




Bitcoin whales held 3.03 million BTC in mid-October 2026, according to CryptoQuant, the most since November 2025. Eight months earlier, the same firm reported an exchange whale ratio of 0.64, its highest since October 2015, and said large investors were driving the selling. Both count as whale data, although one tracks balances and the other tracks deposits.
Search for a CryptoQuant review 2026, and you'll see the Advanced plan listed at $29 on some pages and $39 on others. Both are right, and the gap is just annual versus monthly billing. This review draws on CryptoQuant's documentation and public pricing, plus outside reporting, all checked in November 2026.
What is CryptoQuant, and why do these readings go wrong?
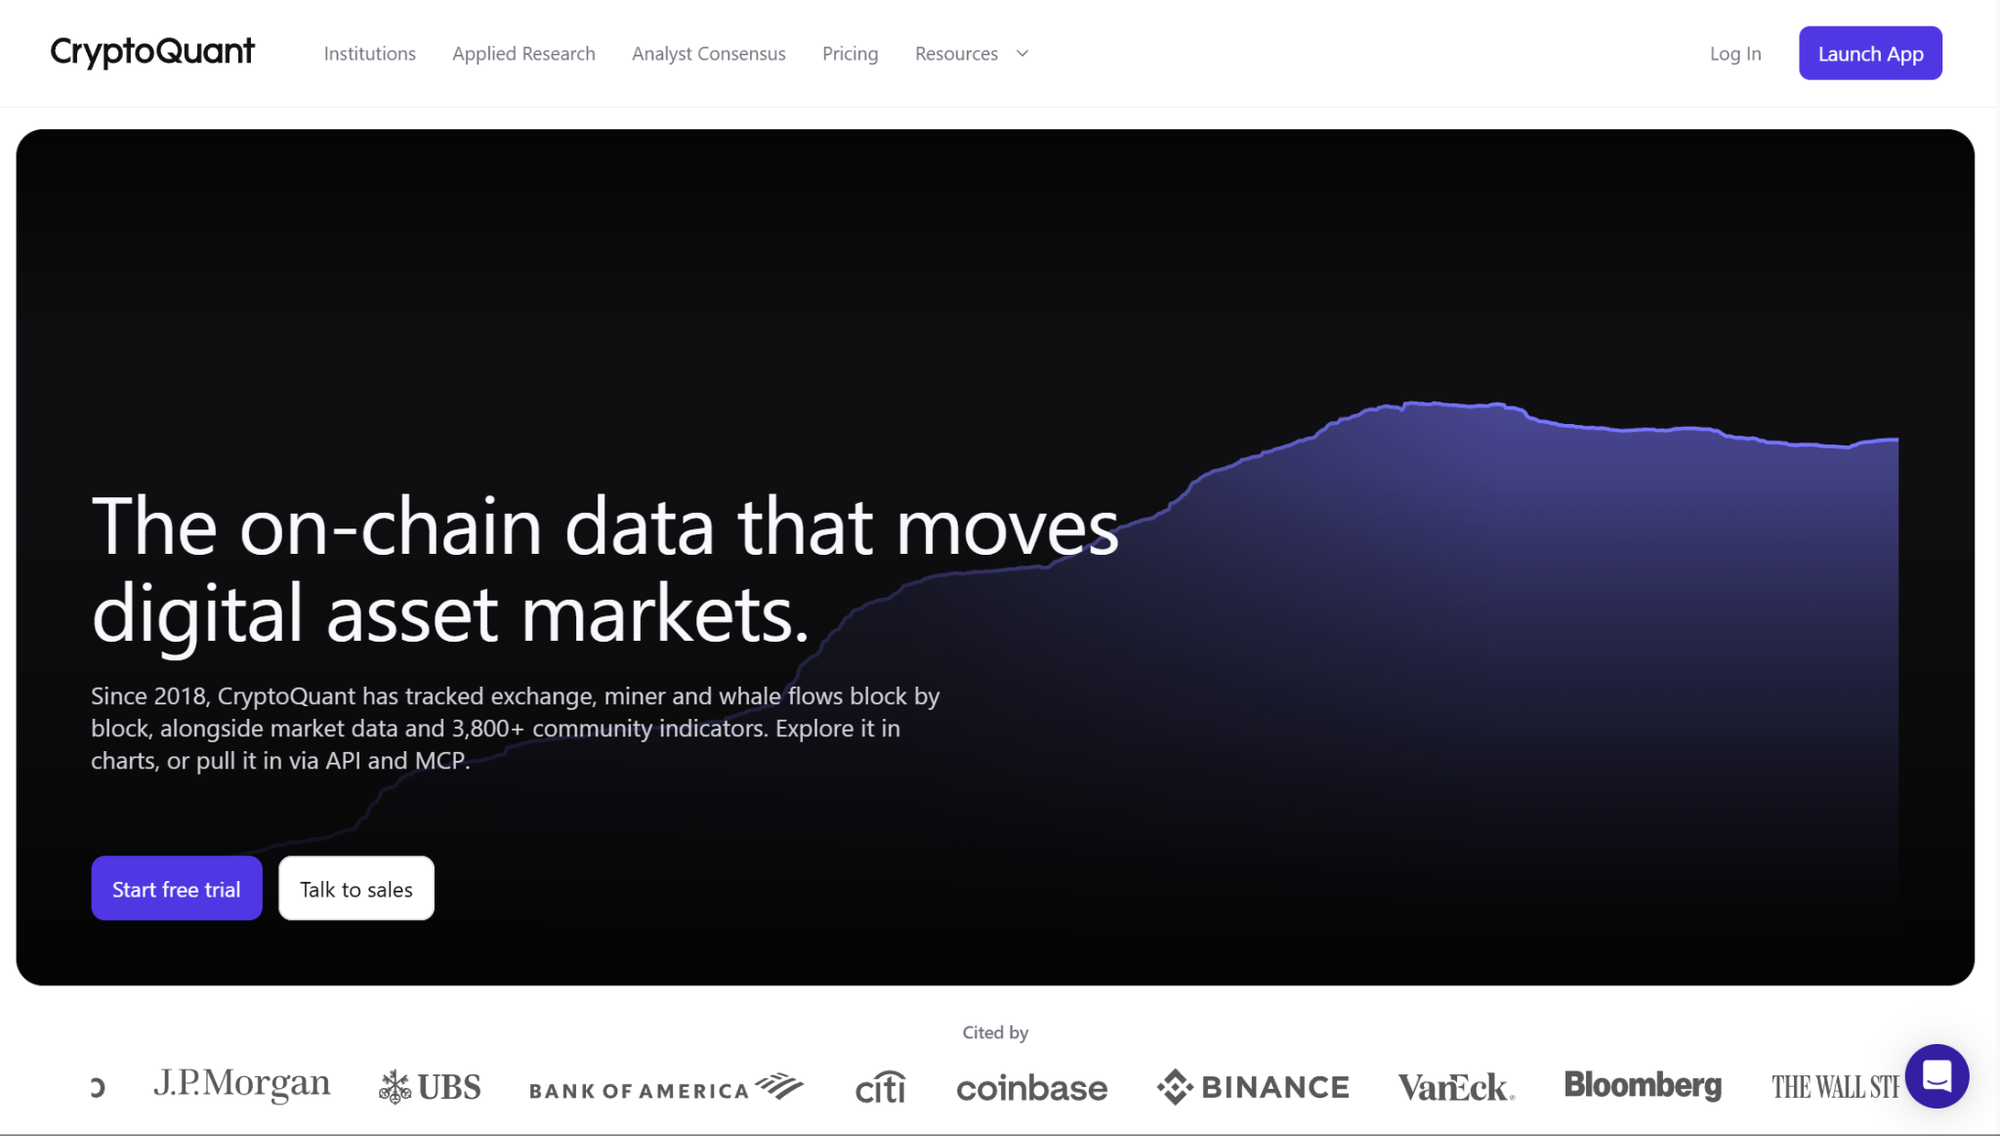
What is CryptoQuant? It's a crypto analytics platform that turns blockchain records and exchange data into charts you can read without running a node. Its user guide says it was founded in 2018, though Cointelegraph's profile of CEO Ki Young Ju dates the start to 2019. On-chain analytics means reading a public ledger for behavior, like who's depositing coins and who's pulling them out. CryptoQuant's on-chain analytics concentrates on the exchange side of that, with crypto market analytics sitting alongside it.
CryptoQuant on-chain data starts as raw records collected from 10+ blockchains plus exchange feeds. The company then decodes contracts and sorts transactions into tables. A blockchain never announces that an address belongs to an exchange, so CryptoQuant works that out through dusting and machine-learning clustering. The same page calls measuring flows "an imperfect science" and advises caution when using them in trading.
On Bitcoin, CryptoQuant data goes deepest, and the metric catalog reaches down to mempool and Lightning Network stats. General altcoins get market data only.
CryptoQuant charts and the metrics that matter
CryptoQuant charts let you adjust resolution and moving averages or filter by entity. The guide bills its feature tour as a six-minute read. Learning what each line means will take you longer.
CryptoQuant exchange flows and reserves
CryptoQuant exchange flows start with two numbers. Inflow means coins deposited into exchange wallets, and outflow means withdrawals. Netflow is the gap between them. The guide calls rising inflows "mostly a Bearish sign" and treats rising outflows as mostly bullish. It also admits some big inflows are just transfers among exchanges, often arbitrage, with nobody dumping anything. Exchange reserves count the total held in exchange addresses.
CryptoQuant whale activity and miner data
The exchange whale ratio divides the top 10 inflow transactions by total exchange inflow, so that 0.64 reading meant ten deposits made up 64% of the flow. The 3.03 million figure is a holdings count that excludes exchange and mining pool addresses. Both fall under CryptoQuant whale activity, and nothing stops them from climbing in the same month.
Miner to exchange tracks coins leaving mining pools for exchange wallets. The guide marks high readings as bearish, since those coins are exposed to selling. For Bitcoin on-chain analysis, network indicators and mempool data can show whether activity matches what price is doing.
Where these readings go wrong
A large deposit is a fact on the ledger. Who made it and why are guesses, because that deposit could be a seller or a custodian moving wallets, and the label on it could be wrong. Trades settled over the counter or on an exchange's internal books don't reach the chain. In its October 2026 whale read, the company itself said: "a short-term pullback is still possible." On-chain indicators aren't guaranteed trading signals, so we'd use them for risk assessment and leave timing to other tools.
Quicktake, alerts and the rest of the toolkit
Quicktake is a bulletin where analysts post short market takes, tagged bullish or bearish, with comments open to everyone. CryptoQuant's Verified Authors publish three times a month and get Professional-level access free, so we'd read their posts as informed opinion from people with ties to the platform. Anyone searching for CryptoQuant signals won't find a product by that name in the user guide.
Alerts come as presets or custom rules, and the presets include whale and miner tracking. Dashboards can be copied from other users. Developers can pull series like Bitcoin's exchange reserve through the API. As for a CryptoQuant app, we couldn't confirm an official mobile one in the guide or a Google Play search. Be careful with lookalike downloads.
CryptoQuant pricing: where free stops being enough
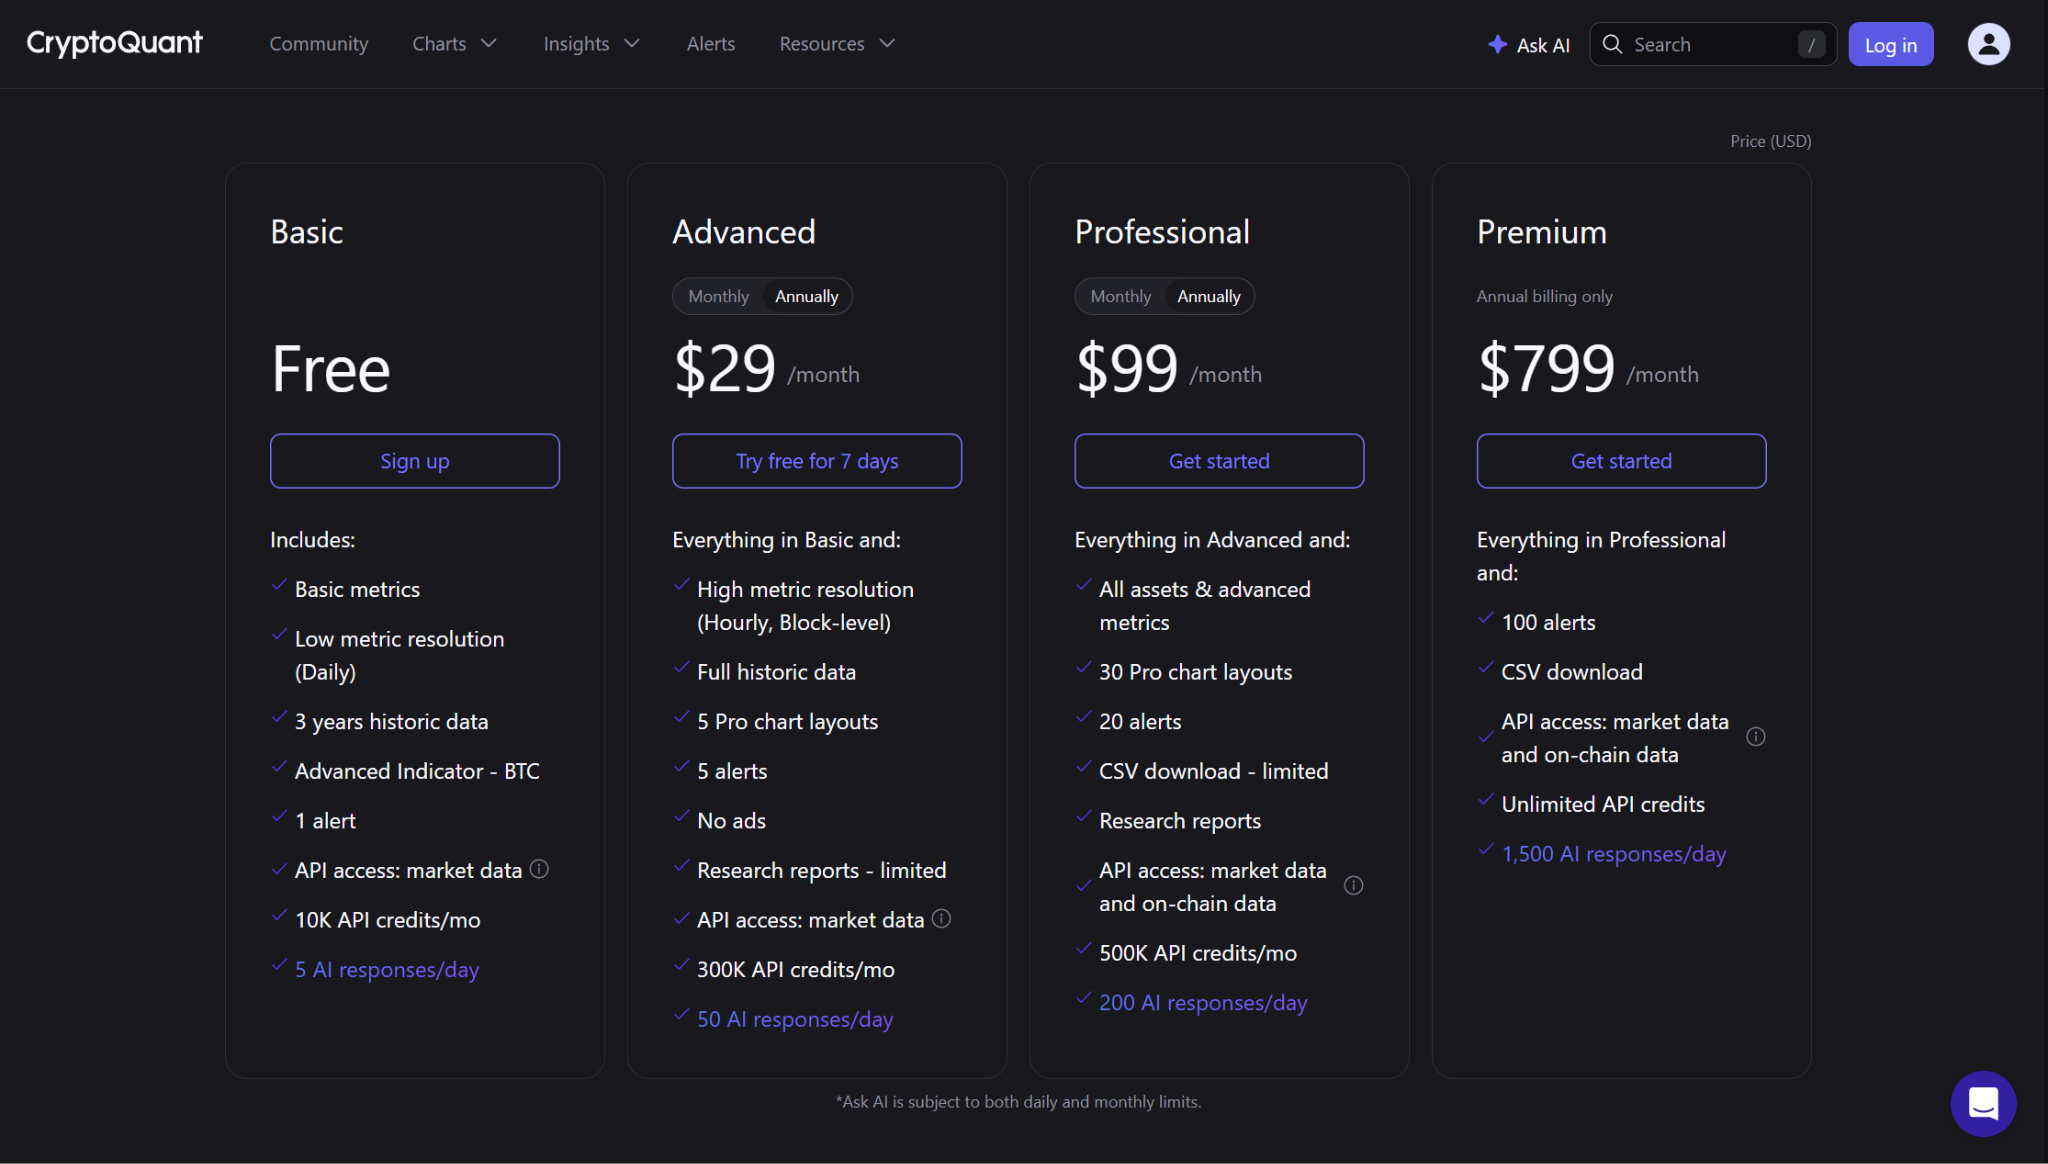
CryptoQuant pricing, according to the pricing page in November 2026, covers four self-serve tiers plus custom Enterprise deals. Basic is free, with daily-resolution basic metrics and three years of history. You also get one alert. Advanced runs $29 a month billed annually or $39 monthly. For us, it's the tier that changes the most, because hourly and block-level data arrive here with full history. It also comes with a seven-day trial, though you'll need a payment method on file.
Professional costs $99 or $109 and adds all assets plus on-chain API access. CryptoQuant Pro chart layouts go up with the tier, with five on Advanced and 30 on Professional. CryptoQuant Premium is another world at $799 a month, annual only. That's $9,588 a year, mainly for unlimited API credits and full CSV downloads. Every plan allows one user per account, so teams will have to ask sales about Enterprise.
How it compares with Glassnode, Nansen and other alternatives
The right CryptoQuant alternative depends on what you're watching. In CryptoQuant vs Glassnode, cost shows up fast. Glassnode's entry plan is $49 a month on annual billing and leaves out API access, while its Professional tier starts at $584 against CryptoQuant's $99. CryptoQuant vs Nansen is a looser match, because Nansen is built around labeled wallets and Smart Money tracking. CryptoSlam only overlaps if NFTs are your market. Prices below come from each platform's own pages, as of November 2026.
Is CryptoQuant worth it?
Whether CryptoQuant analytics justify a subscription depends on the decisions you make with them. The free plan is enough if one daily netflow chart and one alert are all you want. The $29 tier starts to pay off with intraday decisions, like watching inflows during a rally before tightening a stop. Longer netflow trends can also flag a shift worth looking into. Someone buying a fixed amount every month has little use for any of it.
Analysts building models will need Professional for the on-chain API, capped at 120 requests a minute according to the pricing FAQ. Funds are the audience for Premium or Enterprise, and $9,588 is hard to defend unless those API credits feed something that earns money. Altcoin traders will get more from this if the coins they follow are actually in the catalog. Trustpilot won't settle it, with just five reviews so far. The two negative ones are about cookie settings and an account deletion request.
One way to test it is to pull up the netflow for the week of your last bad trade. If that chart wouldn't have changed the decision, the free Basic plan may be all you need.
 Gunel Ismayilova
Disclaimer: All materials on this site are for informational purposes only. None of the material should be interpreted as investment advice. Cryptocurrency investments involve significant risk of loss. Please note that, despite the nature of much of the material created and hosted on this website, HODL FM operates as a media and informational platform, not a provider of financial advisory services. The opinions of authors and other contributors are their own and should not be taken as financial advice. If you require advice, HODL FM strongly recommends contacting a qualified industry professional.