




Every transaction on a public chain is a record anyone can read. The hard part is choosing among the crypto analytics tools that read it for you, because they answer different questions and charge in different ways. This guide sorts blockchain analytics tools by the question each handles best. Figures come from vendor pages unless noted, and prices were checked in October 2026.
What on-chain analytics does, and where the data comes from
On-chain analytics means reading data recorded on public blockchains to see who moves value and where it goes. Chainalysis describes the pipeline: ingest raw data from nodes, then clean, normalize, and index it for querying at scale. Platforms then present the result as dashboards, SQL, alerts, or APIs. The question to ask of every tool here is where its data comes from, and who fixes it when it breaks.
The data is useful because it is hard to fake. Santiment notes that crypto price data is prone to manipulation, so it builds indicators from on-chain, social, and development activity instead.
It helps to separate the layers, because platforms blend them. Raw observations such as hashes, addresses, amounts, and timestamps can be checked by anyone. Labels attach an identity to an address, like exchange or fund. Derived metrics apply a formula on top, such as exchange netflow or supply in profit. Only the first layer is plain fact.
Together they yield wallet activity (balances and history), transaction flows (where value moved and when), token holder data (concentration and how long coins sit unmoved), exchange inflows and outflows, DeFi activity such as locked value and yields, and network metrics like new addresses and validators.
Nine platforms and the questions they answer
Arkham
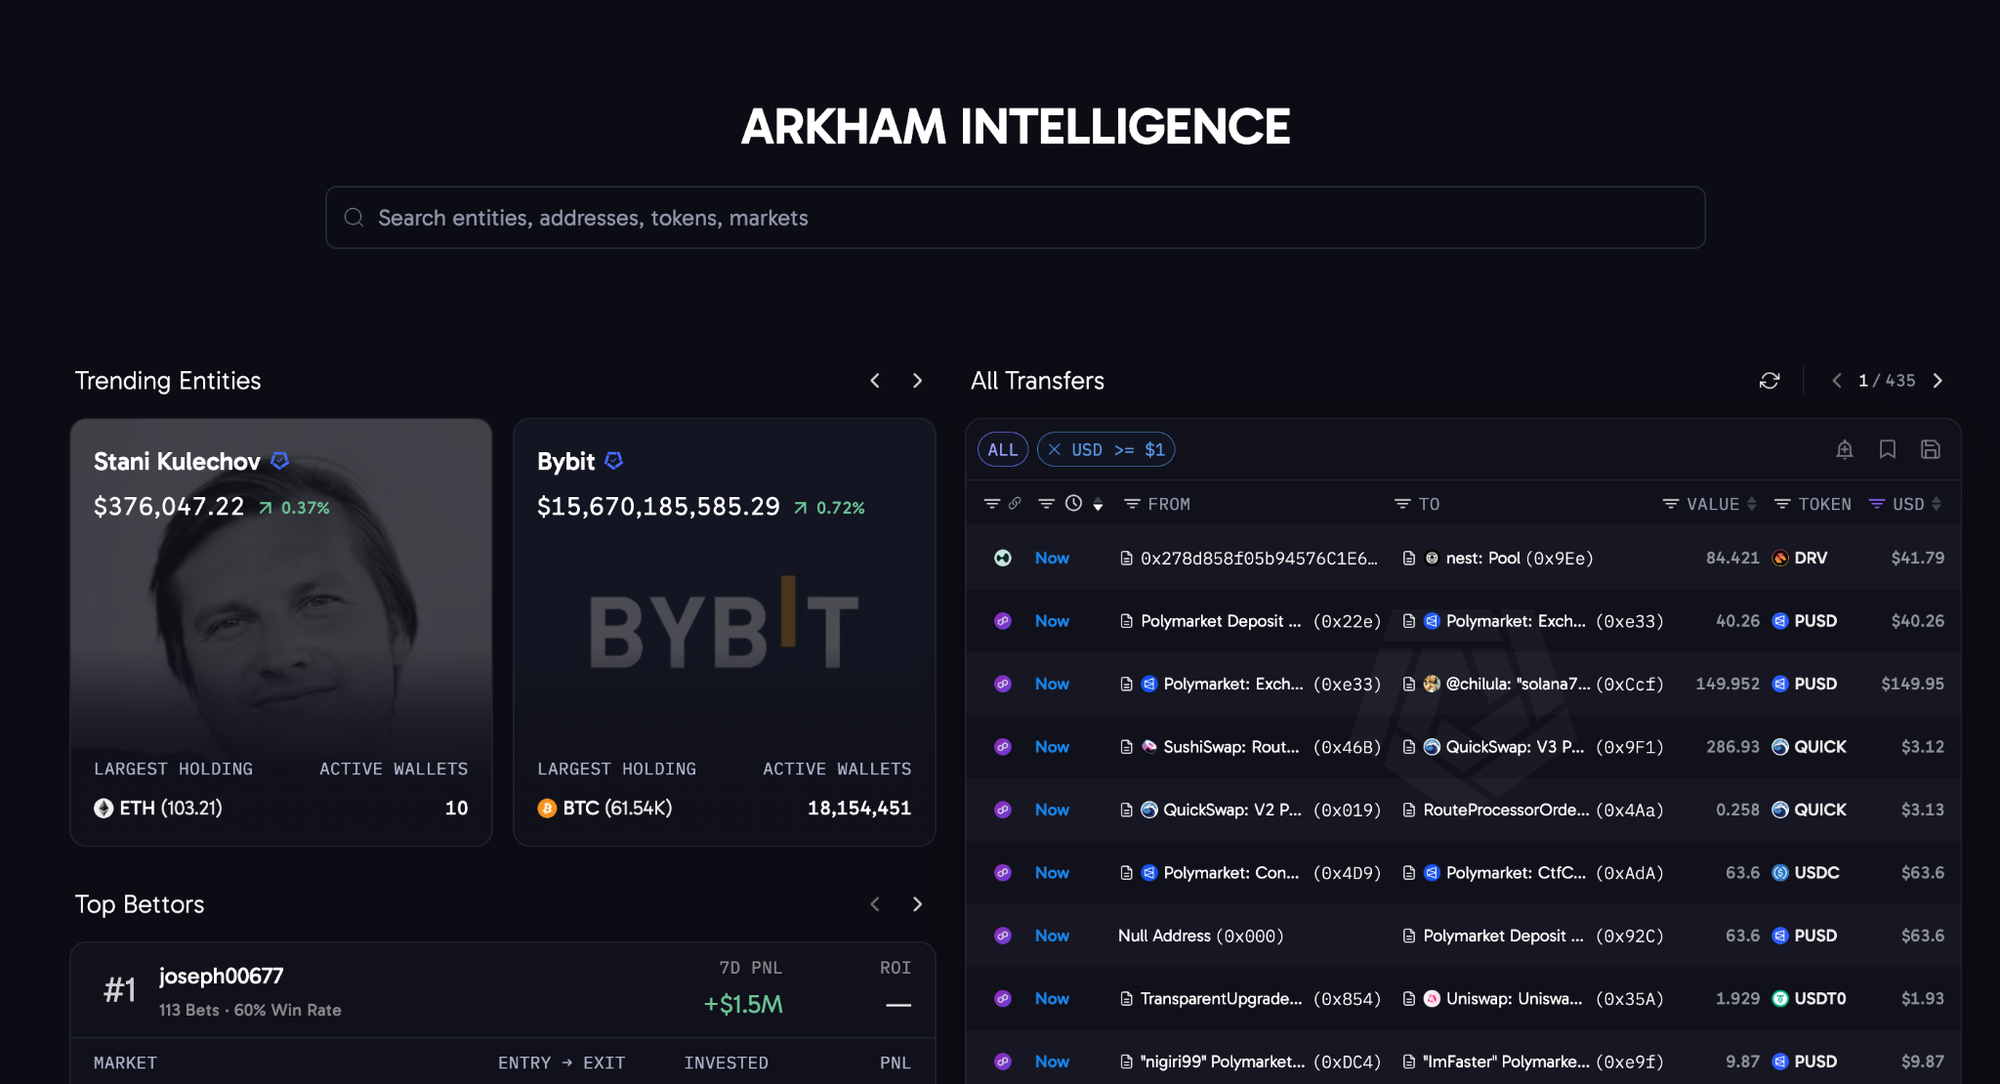
Arkham starts from a name rather than an address. Its ULTRA engine clusters addresses into named entity profiles, so you can search a fund or exchange and see its holdings and transactions. A flow visualizer sits on top, and alerts go out by email, Telegram, or webhook. It is the closest thing here to a general-purpose crypto wallet tracker, and its site lists 16 chains. The app's price is not published; the API has a 30-day trial, then bills by usage credits, with Risk Scores as a separate paid add-on.
Nansen
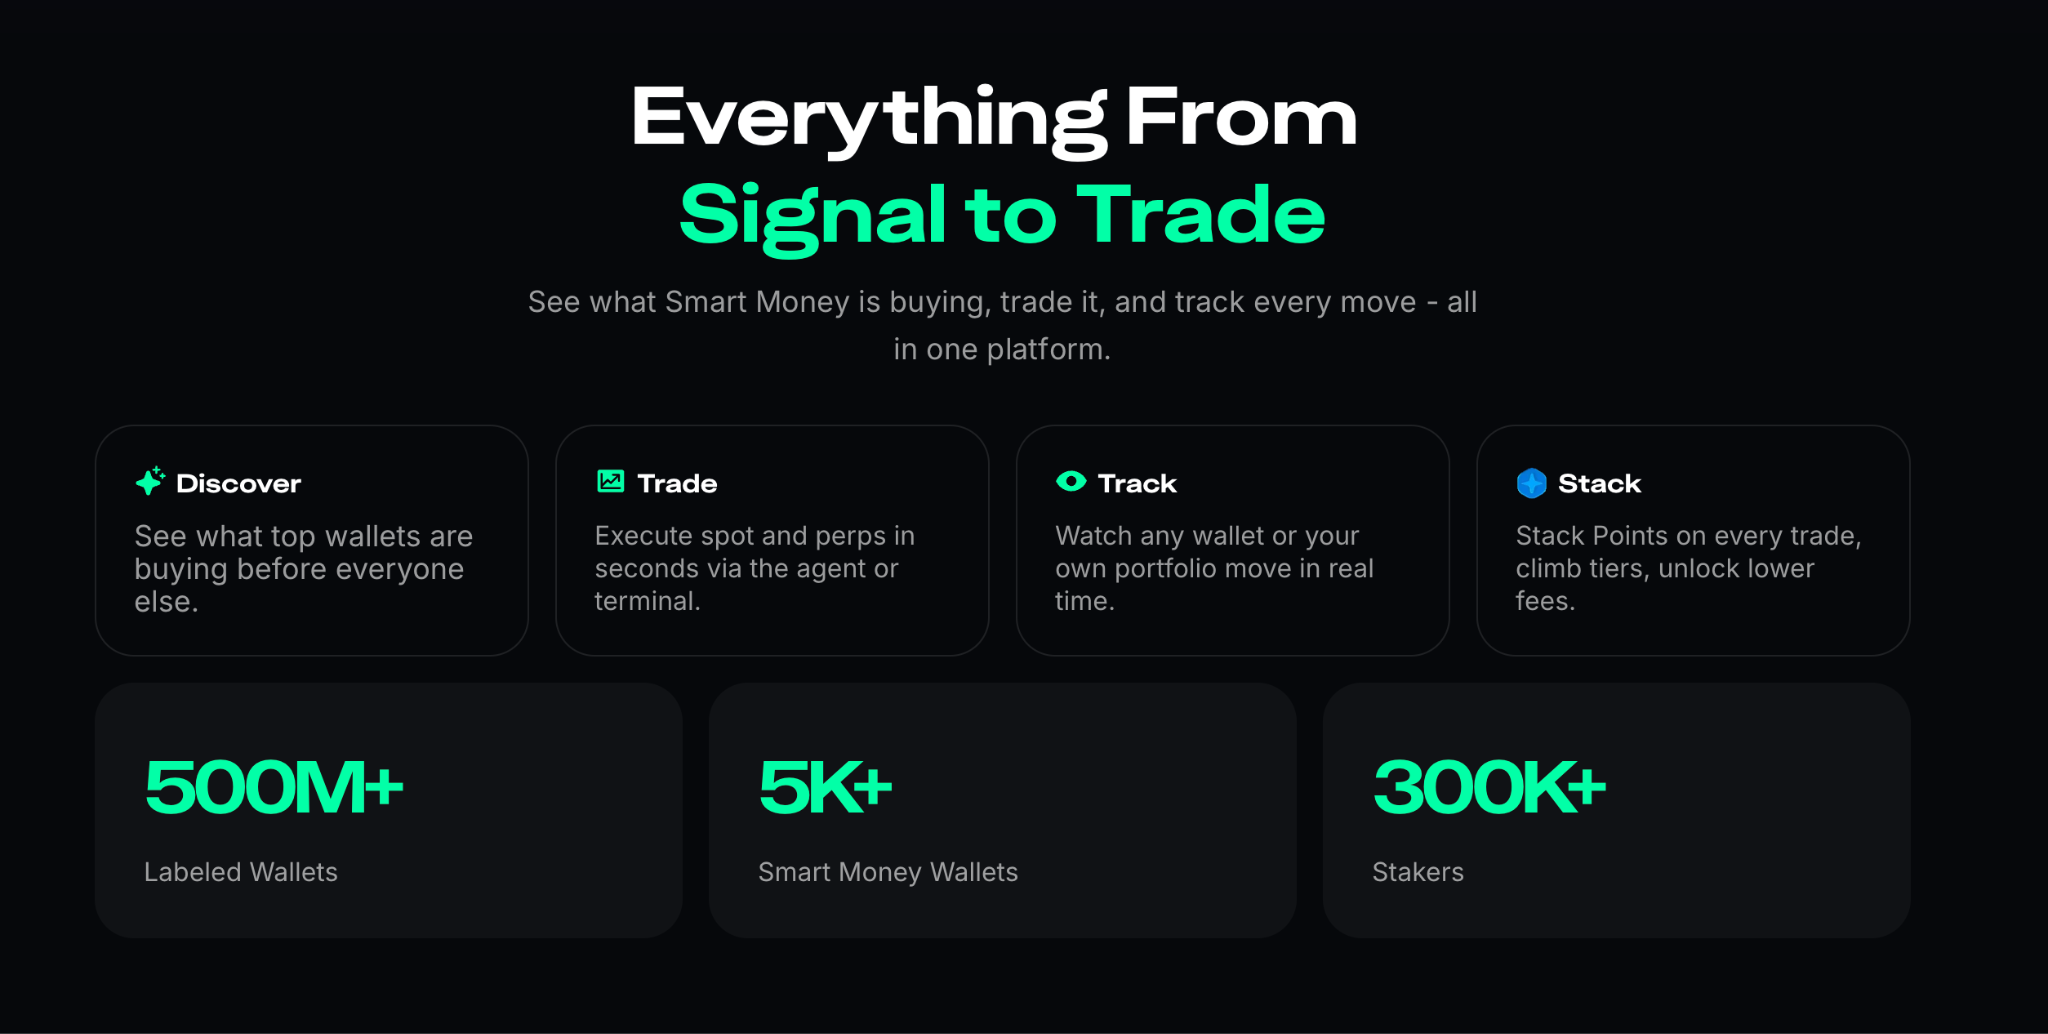
Nansen asks a narrower question: what are wallets with a track record doing right now? Smart Money is its best-known label. It covers 26 chains and ecosystems, including Ethereum, Solana, Base, and Hyperliquid, though depth varies by chain. Nansen collapsed its paid tiers into one Pro plan at $49 a month billed annually ($69 monthly), replacing Professional at $999, and says Pro keeps most of it: full PnL and labels, unlimited alerts, and 2,000 AI prompts. API and MCP access comes only as one-time credits.
Glassnode
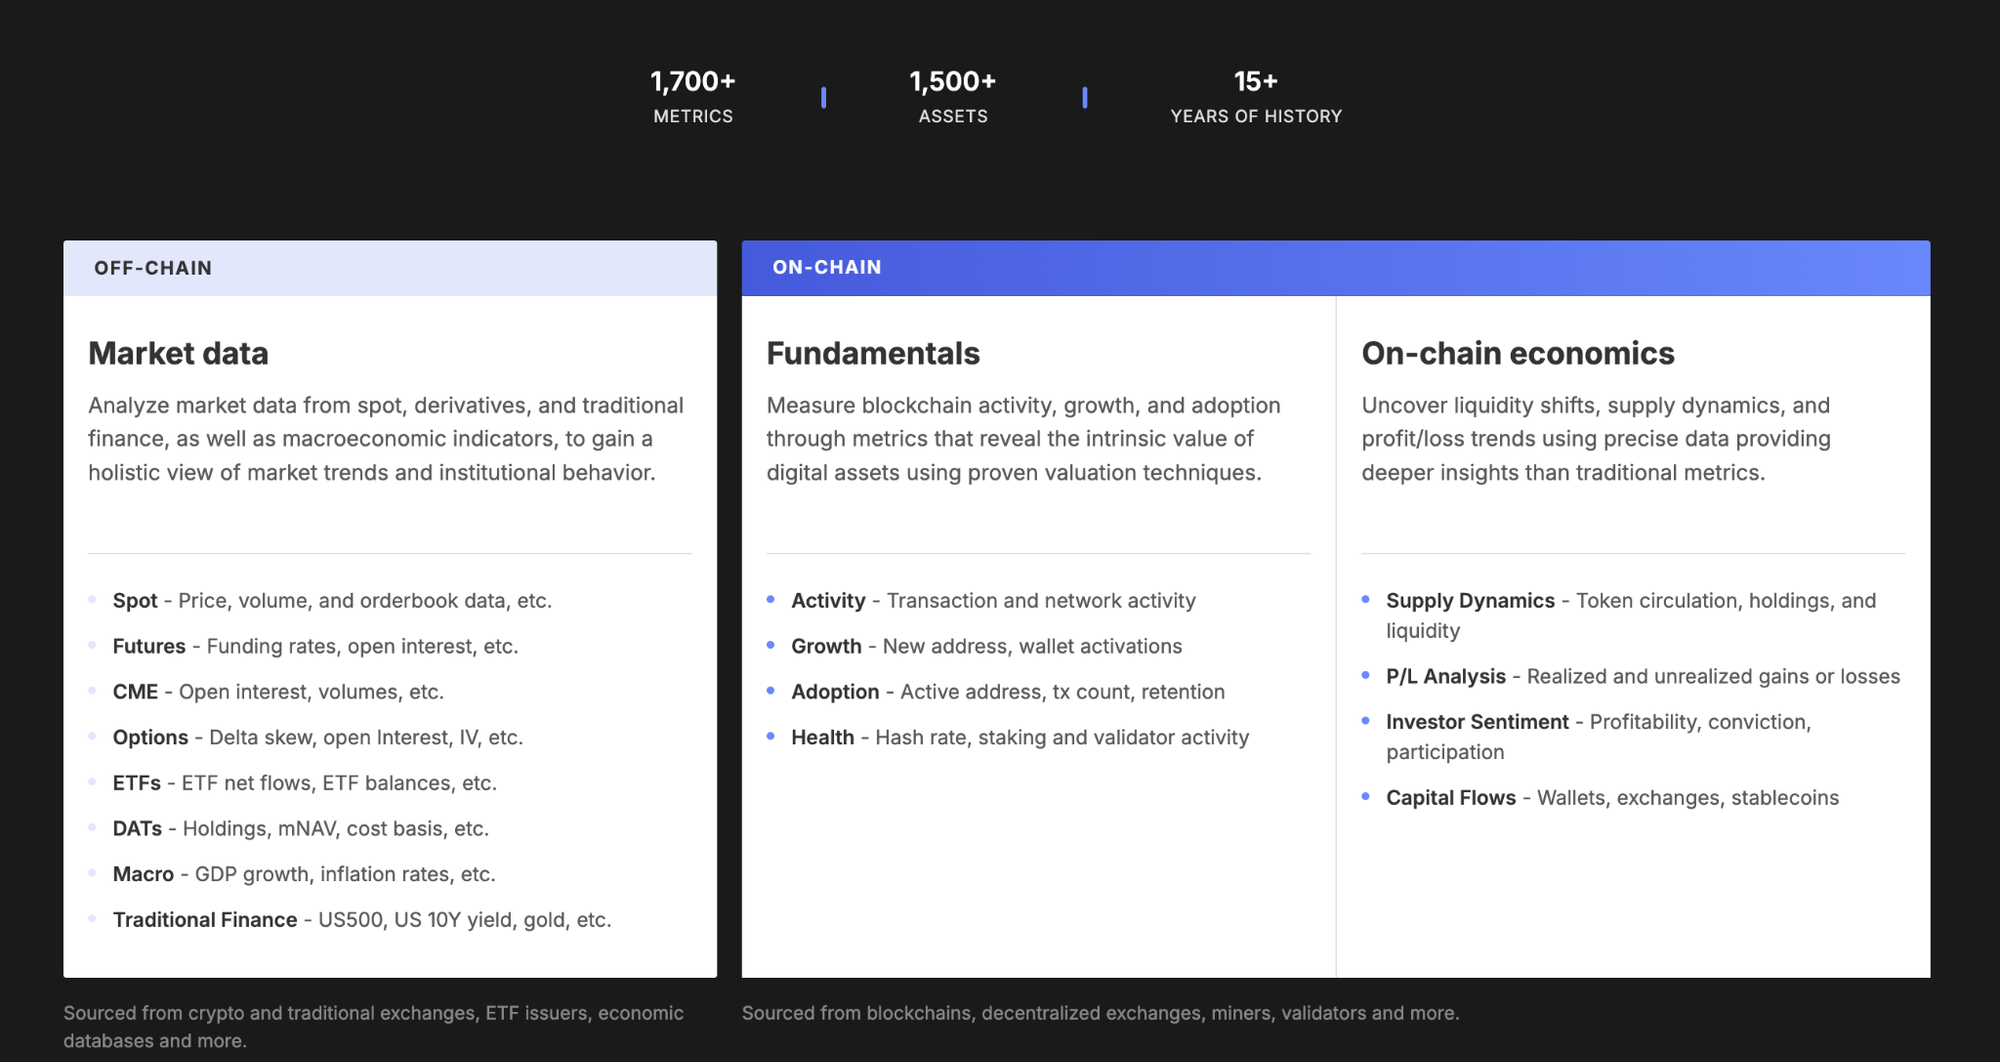
Glassnode suits readers who care more about where the market sits in a cycle than about any single wallet. It lists 1,500+ assets and 15+ years of history, with on-chain data beside futures, options, and ETF flows, though that on-chain data covers 11 blockchains. Advanced costs $49 a month billed annually and has no API. Professional is sold as packages from $4,900 a year, or $11,200 for market and on-chain data together. Full access adds $3,000 and unlocks Point-in-Time metrics, which never receive retroactive updates, so quant teams backtesting strategies pay for them.
CryptoQuant
CryptoQuant has tracked exchange, miner, and whale flows block by block since 2018. Its API returns 245+ metrics across Bitcoin, Ethereum, XRP, TRON, stablecoins, and ERC-20 tokens, and the company says the Federal Reserve cites its data. Basic is free; Advanced costs $29 a month billed annually, Professional $99, and Premium $799. The API split is the catch: on-chain endpoints start at Professional.
Santiment
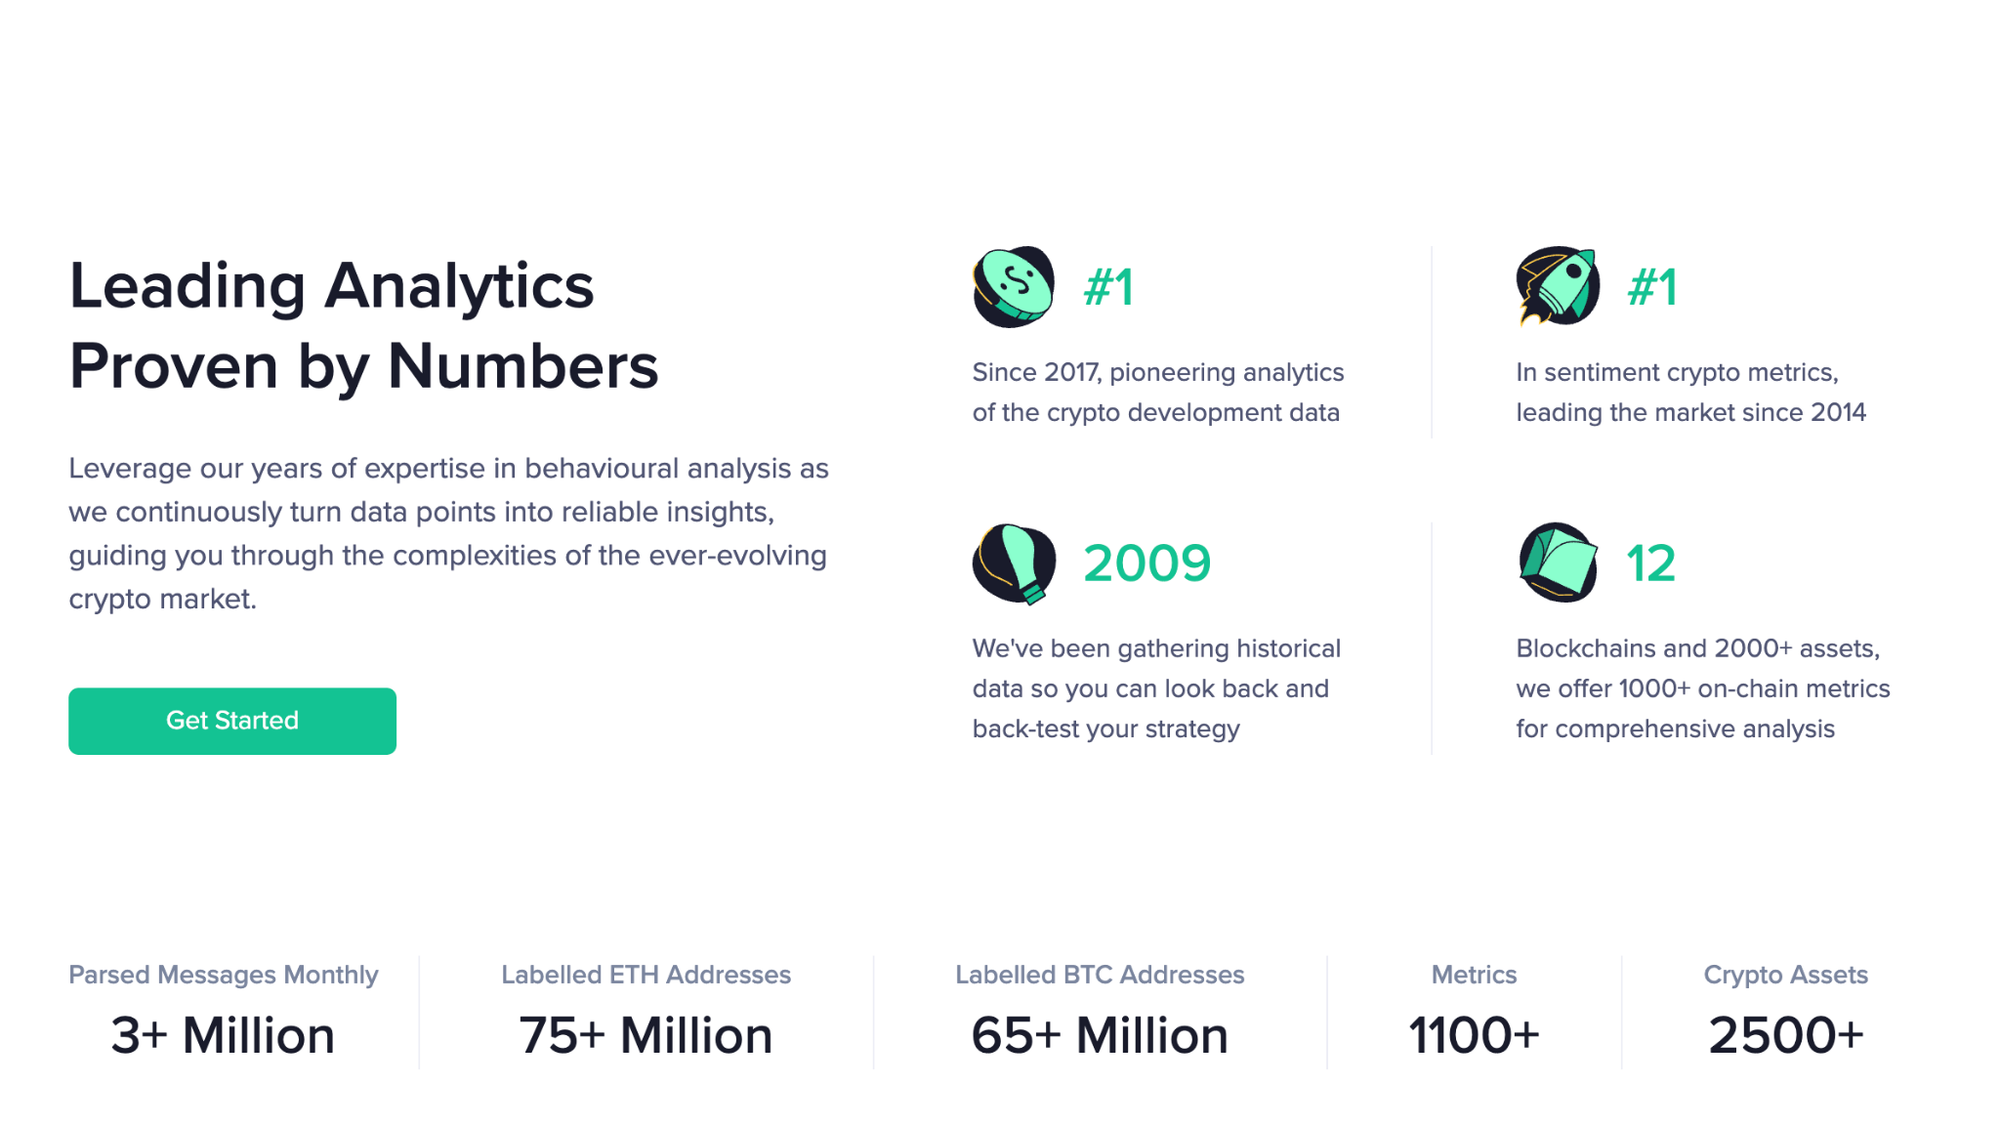
Santiment is the odd one out, since part of its signal is not on-chain. It adds social volume and development activity, so a price move can be checked against chatter and code commits. Its guide links extreme social-volume spikes to local tops, a heuristic rather than a law. As of February 2026, it covers 12 blockchains and the top 3,000 assets. Sanbase Pro costs $39 a month billed annually, Max $199 (the minimum for real-time API data), and Business plans $340 to $799.
DefiLlama
DefiLlama works like a directory for DeFi, covering 400+ chains and 8,000+ protocols. TVL comes from open-source adapters, and it leaves chain-staked assets out on purpose, so the number follows DeFi usage rather than token price. Core data and public API endpoints are free. Pro costs $39.83 a month billed annually and adds custom dashboards and CSV exports but no API, which is a separate $300-a-month plan with 1,000 requests a minute and MCP access.
Token Terminal
Token Terminal treats protocols like companies, converting decoded contract activity into GAAP-like metrics such as fees and revenue across 100+ chains and 1,200+ applications. Free gives full history and three dashboards, without CSV exports, MCP, or team access. Pro costs $292 a month billed annually ($350 monthly) and adds those along with unlimited dashboards. The API (250,000 requests a day) and Datashare (raw data via BigQuery and Snowflake) are custom-priced.
Dune
Dune is a blank slate, which is both its appeal and its cost. It supports 100+ chains and runs on SQL: raw tables for blocks, transactions, logs, and traces, plus decoded contracts. Free is view-only but lets you copy any public query. The Analyst plan costs $65 per month, billed annually, and is the first tier that lets you run your own queries. The Plus plan costs $349 per month and adds private dashboards and CSV exports.
Sentora (formerly IntoTheBlock)
IntoTheBlock merged with Trident Digital in May 2025 to form Sentora. Research is free, but the commercial focus is now DeFi Strategies: on-chain yield products across 12+ blockchains for exchanges, custodians, and treasuries. There is no single price: the June 2026 Terms of Use describe deposit, withdrawal, and software fees, and vaults carry performance fees.
Compliance teams and investigators are a separate market. Chainalysis Reactor traces funds, and access is sales-led.
Quick comparison
What it costs
Prices are monthly on annual billing unless stated. Free tiers are good at “what’s the number?” and paid tiers buy you alerts, exports, and API access.
A whale example
In April 2023, according to Arkham’s own guide, an address dormant for over ten years moved 400 of its 1,000 BTC, and the coins later reached exchanges. That looks like a sale. It isn’t necessarily one. A transfer can be custody, collateral, or settlement. Check the label first, since a fund, an exchange wallet, and an unlabeled address mean different things, then confirm the move in a block explorer.
Where the data falls short
- Labels can be wrong. One address isn’t one person, clustering throws false positives, and attributions go stale.
- Tools disagree. Chainalysis’s Jacob Illum wrote about a customer who got two different answers for the same deposit address from two tools.
- Public isn’t complete. Exchange trades, derivatives, and intent stay off-chain until funds touch the blockchain.
- Methods change. DefiLlama leaves chain-staked assets out of TVL, and an updated label set can revise historical exchange flows.
The rule that covers all of it: a hash, a block, or a balance is verifiable, while a label or risk score is an interpretation. If a dashboard flags something that matters to a decision, open the transaction in a block explorer and check it yourself.
 Tanya Petrusenko
Disclaimer: All materials on this site are for informational purposes only. None of the material should be interpreted as investment advice. Cryptocurrency investments involve significant risk of loss. Please note that, despite the nature of much of the material created and hosted on this website, HODL FM operates as a media and informational platform, not a provider of financial advisory services. The opinions of authors and other contributors are their own and should not be taken as financial advice. If you require advice, HODL FM strongly recommends contacting a qualified industry professional.