






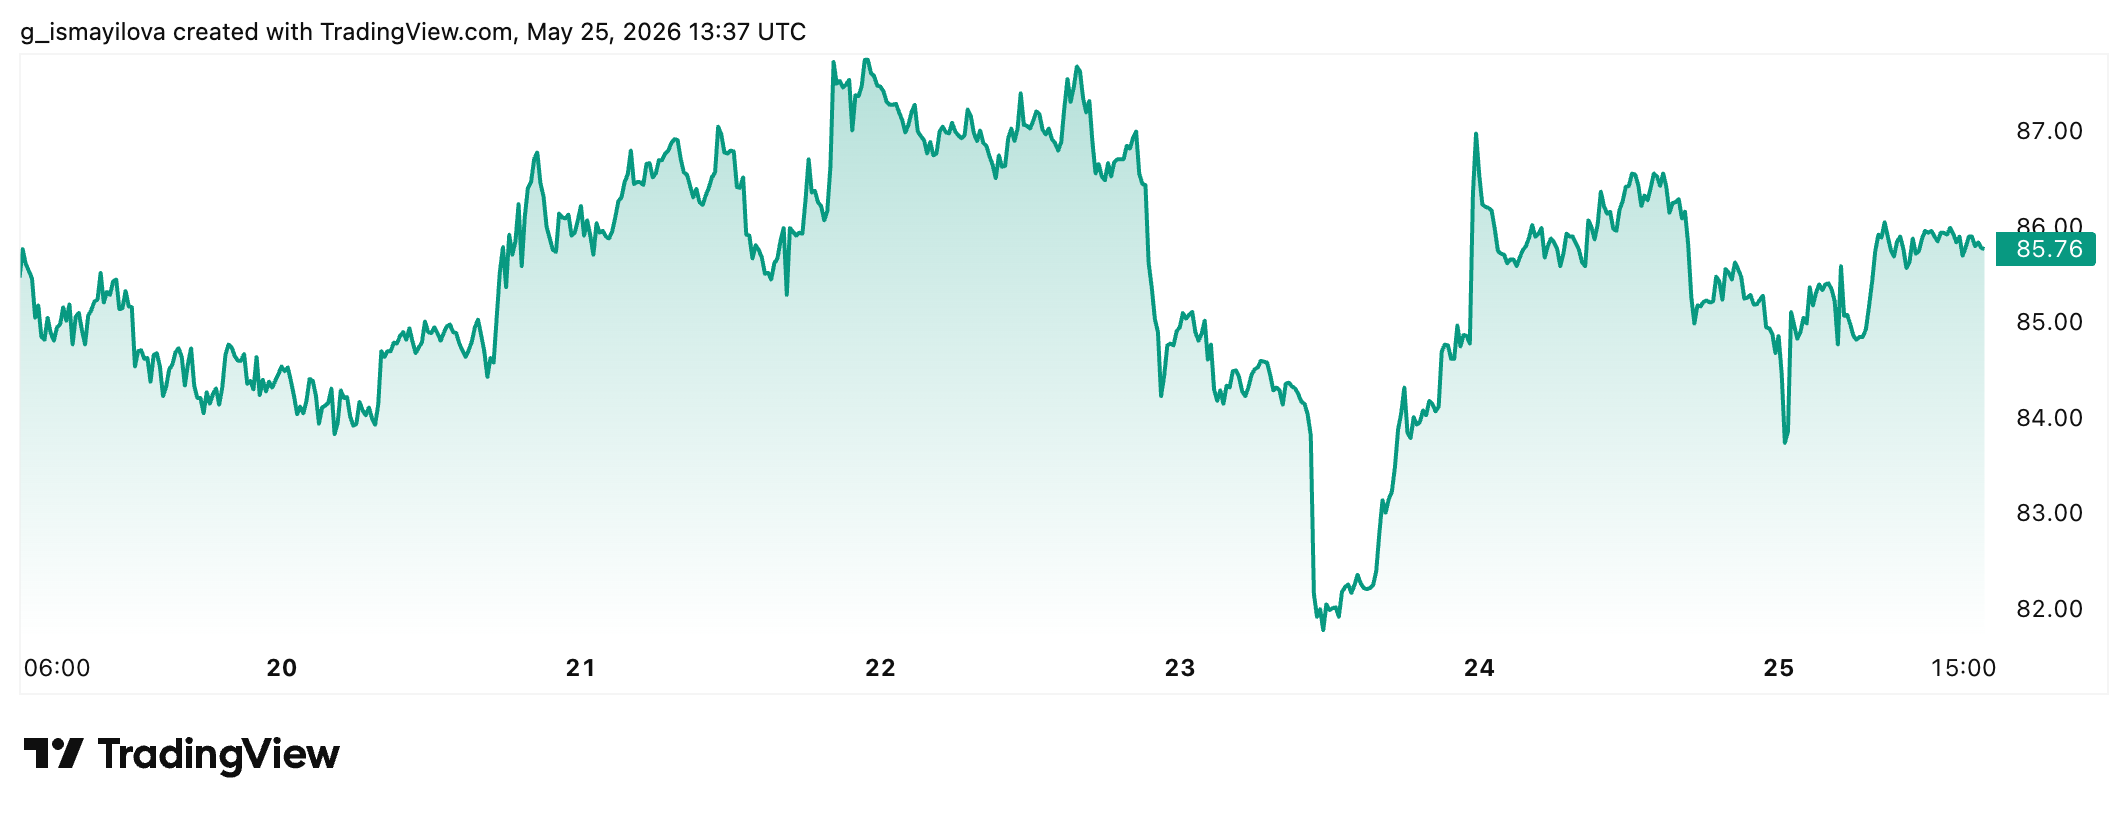
Solana traded near $85 at press time, according to HODL FM data, after a sharp pullback from its early May peak near $100. The roughly 15% decline reflects a broader shift in market sentiment as capital rotates away from higher-risk crypto assets.
The drop coincides with a wave of outflows from U.S.-based crypto investment products. More than $1 billion exited these products in a single week, as investors reduced exposure ahead of expected commentary from the Federal Reserve and fresh inflation data. This shift has weighed heavily on altcoins, which often rely on stronger risk appetite to sustain momentum.
Institutional repositioning adds pressure
Institutional activity has played a direct role in Solana’s recent weakness. Goldman Sachs disclosed that it exited several exchange-traded product positions tied to Solana and XRP. The move reinforced concerns that institutional capital has started to rotate away from speculative segments of the crypto market.
Solana-linked products ranked among the hardest hit during the latest outflow cycle. This trend aligns with a broader defensive posture across financial markets, where uncertainty around monetary policy has pushed investors toward lower-risk assets.
Macro conditions have compounded the pressure. Elevated Brent crude prices, tied to concerns over shipping disruptions near the Strait of Hormuz, have complicated expectations for rate cuts. Ongoing monitoring of negotiations between the United States and Iran has added another layer of uncertainty. These factors have reduced appetite for volatile assets such as Solana.
On-chain slowdown reflects fading momentum
Network data also points to weakening fundamentals in the short term. Decentralized exchange activity on Solana has dropped sharply after a slowdown in meme coin trading volumes. That segment had fueled strong growth earlier in the year.
Weekly DEX volume on the network has fallen by more than 20% from recent highs, as per Defillama data. The decline has reduced fee generation and weakened transactional demand for SOL.
Competing ecosystems have attracted liquidity that previously flowed into Solana-based applications. Base and Hyperliquid have seen increased trader participation. Hyperliquid has gained traction in decentralized derivatives, where demand for perpetual trading remains strong.
hyperliquid:native has outperformed every single coin this cycle.
— HodlFM (@Hodl_fm) May 25, 2026
Hyperliquid is already in a bull market of its own while the rest of crypto is deep in the bear 🩸 pic.twitter.com/0wKBmXcy71
This shift has diverted both liquidity and speculative volume away from Solana-native platforms. The result has been a softer demand profile across the ecosystem, even as development activity continues.
Technical structure signals vulnerability
Market structure has weakened after Solana failed twice to break through the $98 to $100 resistance zone. The daily chart now shows a developing double-top formation, with both rejection points near the same supply area.
The neckline for this pattern sits near $78. This level has served as a key support zone since March. A confirmed move below that threshold could validate the bearish setup and open the path toward lower price levels.
Pattern projections suggest downside targets could extend toward $64 if selling pressure accelerates. This projection reflects the height of the formation measured from the resistance zone to the neckline.
Solana also trades below its Supertrend resistance near $94.80. Daily candles have struggled to close above descending resistance levels formed after the late April rejection. This structure has limited bullish momentum.
Conditions that could shift momentum
Macro developments remain critical. Softer inflation data or signals of policy easing from the Federal Reserve could improve risk appetite and support renewed inflows into altcoins.
Network activity also remains a key variable. A revival in meme coin trading or a rebound in decentralized finance activity on Solana could restore fee generation and strengthen demand for SOL.
For now, the market reflects a cautious stance. Solana trades below key resistance levels, while institutional flows and on-chain data point to reduced momentum. The $80 threshold stands as a critical level in the near term as traders assess liquidity conditions and macro risks.
Disclaimer: All materials on this site are for informational purposes only. None of the material should be interpreted as investment advice. Please note that, despite the nature of much of the material created and hosted on this website, HODL FM operates as a media and informational platform, not a provider of financial advisory services. The opinions of authors and other contributors are their own and should not be taken as financial advice. If you require advice, HODL FM strongly recommends contacting a qualified industry professional.