

Ethereum shows signs of renewed short-term pressure as large volumes move onto exchanges and derivatives activity weakens. Recent data from CryptoQuant highlights a shift in market structure that raises the risk of another downside move.
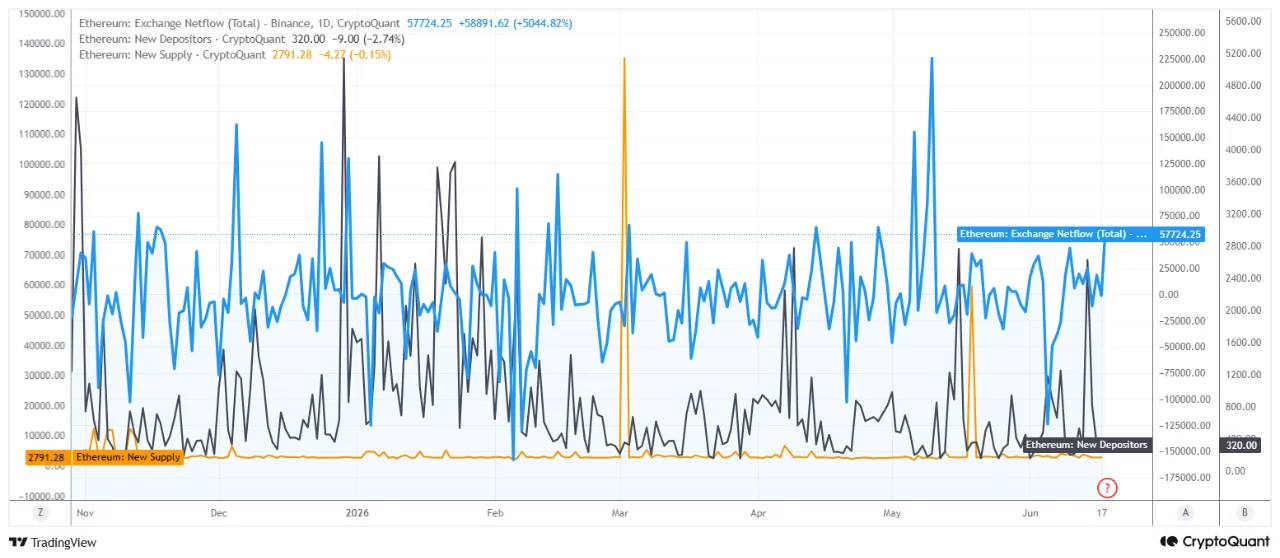
Crypto analyst Pelin Ay reported that approximately 57,700 ETH flowed into Binance on a net basis over recent days. This volume stands out given Binance’s role as a primary liquidity hub. Large inflows to exchanges often signal intent to sell rather than hold assets in private wallets.
The timing of these inflows coincides with slowing participation from new market entrants. CryptoQuant data shows the number of new ETH depositors remains near 320 addresses. This level sits well below previous demand surges. The gap between rising supply on exchanges and muted new demand creates a fragile balance.
Weak participation shifts market reliance to existing holders
The absence of strong new inflows of capital has altered the structure of Ethereum’s recent price stability. Current price support appears to depend on existing holders rather than fresh buyers.
Pelin Ay noted that the lack of new participants reduces the sustainability of any upward movement. Without new capital, rallies tend to lose momentum near resistance levels. The data reflects a market where internal rotation replaces expansion.
Ethereum’s supply dynamics provide a counterweight. Daily issuance stands near 2,791 ETH. This figure remains low compared to previous cycles due to the network’s post EIP-1559 token model. Reduced issuance limits long-term inflation pressure.
This supply constraint creates a mixed outlook. Short-term signals point to selling pressure, while long-term fundamentals show tighter supply conditions.
Derivatives activity drops to multi-month lows
Exchange data aligns with a broader cooling across derivatives markets. Ether futures open interest has fallen to $10.3 billion, down from $15 billion a month earlier. This decline represents a drop of roughly 31% and marks the lowest level since April 2025.
The reduction in open interest reflects a pullback in speculative positioning. Fewer active contracts suggest lower conviction among traders. This shift also reduces the likelihood of large liquidation-driven price swings in the near term.
Leverage metrics show a similar trend. The estimated leverage ratio dropped to 0.83 from 1.10 in early June. This move represents the largest unwind since October 2025, based on CryptoQuant data.
Lower leverage often leads to calmer price action, but it also signals reduced appetite for risk. The combination of declining leverage and falling open interest reinforces the cautious tone across the market.
Key price levels come into focus
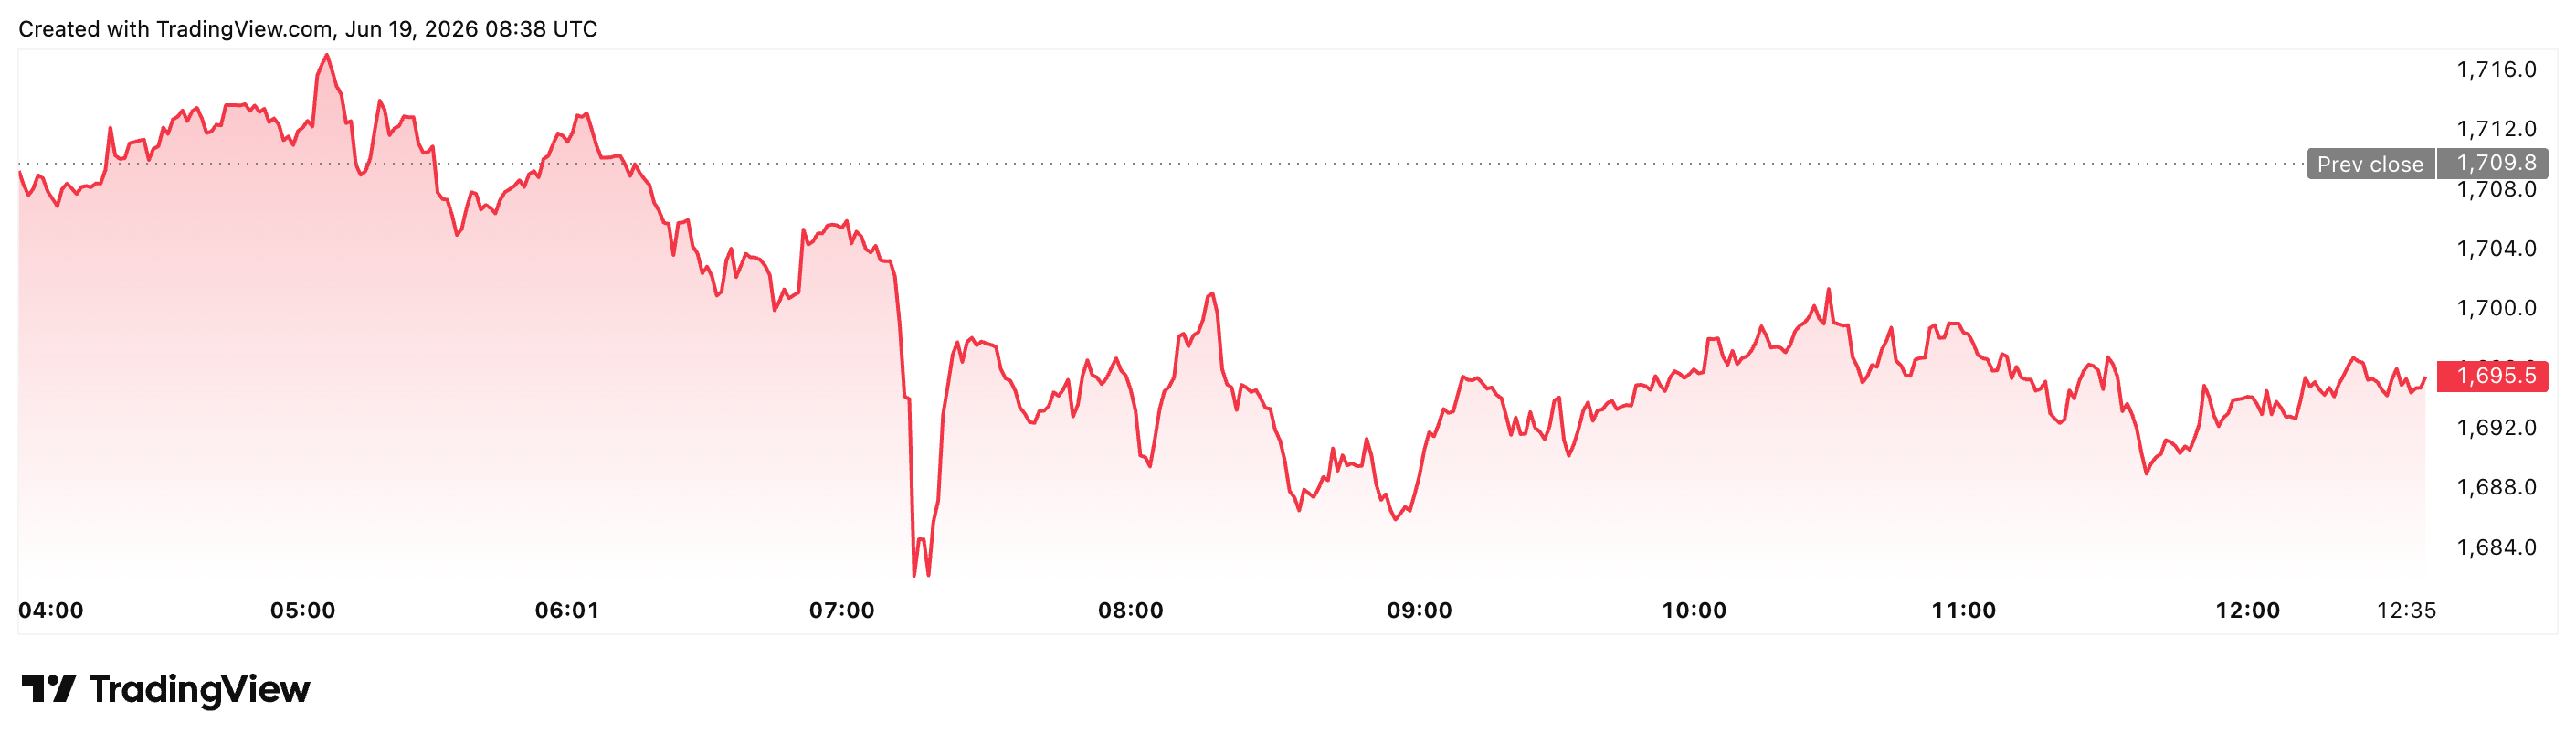
Ethereum’s price structure shows sustained pressure over recent weeks. The asset has declined about 30% over the past 42 days. It now trades near a key demand zone between $1,700 and $1,400.
The April 2025 low at $1,384 serves as the nearest downside target if weakness continues. A break below that level could expose the January 2023 demand range between $1,289 and $1,071.
Short-term rallies may face resistance if exchange inflows remain elevated. Pelin Ay stated that high net inflows increase the probability of another selling wave near resistance levels.
The relative strength index offers additional context. The weekly RSI stands near 31 after a sharp drop during the recent sell-off. A daily RSI reading reached 11, its lowest level on record. These levels suggest oversold conditions, which can precede periods of consolidation or recovery.
Market enters a critical phase
Ethereum now sits at a point where opposing forces define its trajectory. Exchange inflows and weak participation point to near-term downside risk. At the same time, limited supply growth and oversold technical conditions support the case for stabilization.
The balance between these factors will likely determine the next move. If demand returns, constrained supply could amplify upward momentum. If inflows persist without new buyers, the market may test lower support zones before any sustained recovery.
For now, the data presents a cautious outlook with clear pressure points on both sides of the market.
Disclaimer: All materials on this site are for informational purposes only. None of the material should be interpreted as investment advice. Please note that, despite the nature of much of the material created and hosted on this website, HODL FM operates as a media and informational platform, not a provider of financial advisory services. The opinions of authors and other contributors are their own and should not be taken as financial advice. If you require advice, HODL FM strongly recommends contacting a qualified industry professional.