

Ethereum extended its decline this week, dropping below the $1,800 level for the first time since May 2025 and deepening losses across the broader crypto market. The token traded within a 24-hour range between $1,734.05 and $1,886.55, with price action showing persistent selling pressure despite attempts by buyers to defend lower levels.
Over the past seven days, Ethereum has lost 10.21%, which reflects sustained weakness as market sentiment deteriorates. The break placed the asset close to levels last seen in April 2025, when Ethereum approached $1,400 before a recovery followed.
Market structure shows continued weakness
Ethereum’s broader structure remains under pressure. The asset trades well below its Aug. 24, 2025 all-time high of $4,946.05, with a decline of 64.05% from that peak. The recent breakdown adds to a pattern of lower highs and lower lows that has persisted for months.
On shorter timeframes, Ethereum dropped below $1,840 and $1,820 before forming a local low near $1,716. The price now sits under the 100-hour simple moving average, with a bearish trend line forming near $1,800 on the hourly chart, based on HodlFM data.
Resistance levels appear at $1,800 and $1,820, followed by stronger barriers near $1,850 and $1,880. Support remains concentrated around $1,720 and $1,700. A break below those levels would shift focus toward $1,665, $1,640 and potentially $1,620.
The $1,700 area holds particular importance. Market data shows limited structural support between that level and the $1,400 zone, which served as a key base during earlier cycles.
Technical indicators confirm seller control
Indicators continue to favor sellers. The Supertrend indicator shows a bearish signal, with resistance near $2,022.09. Ethereum trades below that level, which confirms the current trend direction.
The Relative Strength Index stands at 21.60, which places ETH deep in oversold territory. This reading reflects strong downside momentum. It does not guarantee a reversal. The RSI moving average remains above the current level, which indicates that buyers have not regained control.
The MACD also supports a bearish outlook. The MACD line sits below the signal line, while the histogram remains negative. A shift would require the MACD line to flatten and move upward toward the signal line.
Additional chart metrics support the same view. Ethereum trades below key exponential moving averages, including the 20-day, 50-day and 100-day ranges, which cluster above $2,000. Those levels now act as resistance.
Investor behavior shifts across markets
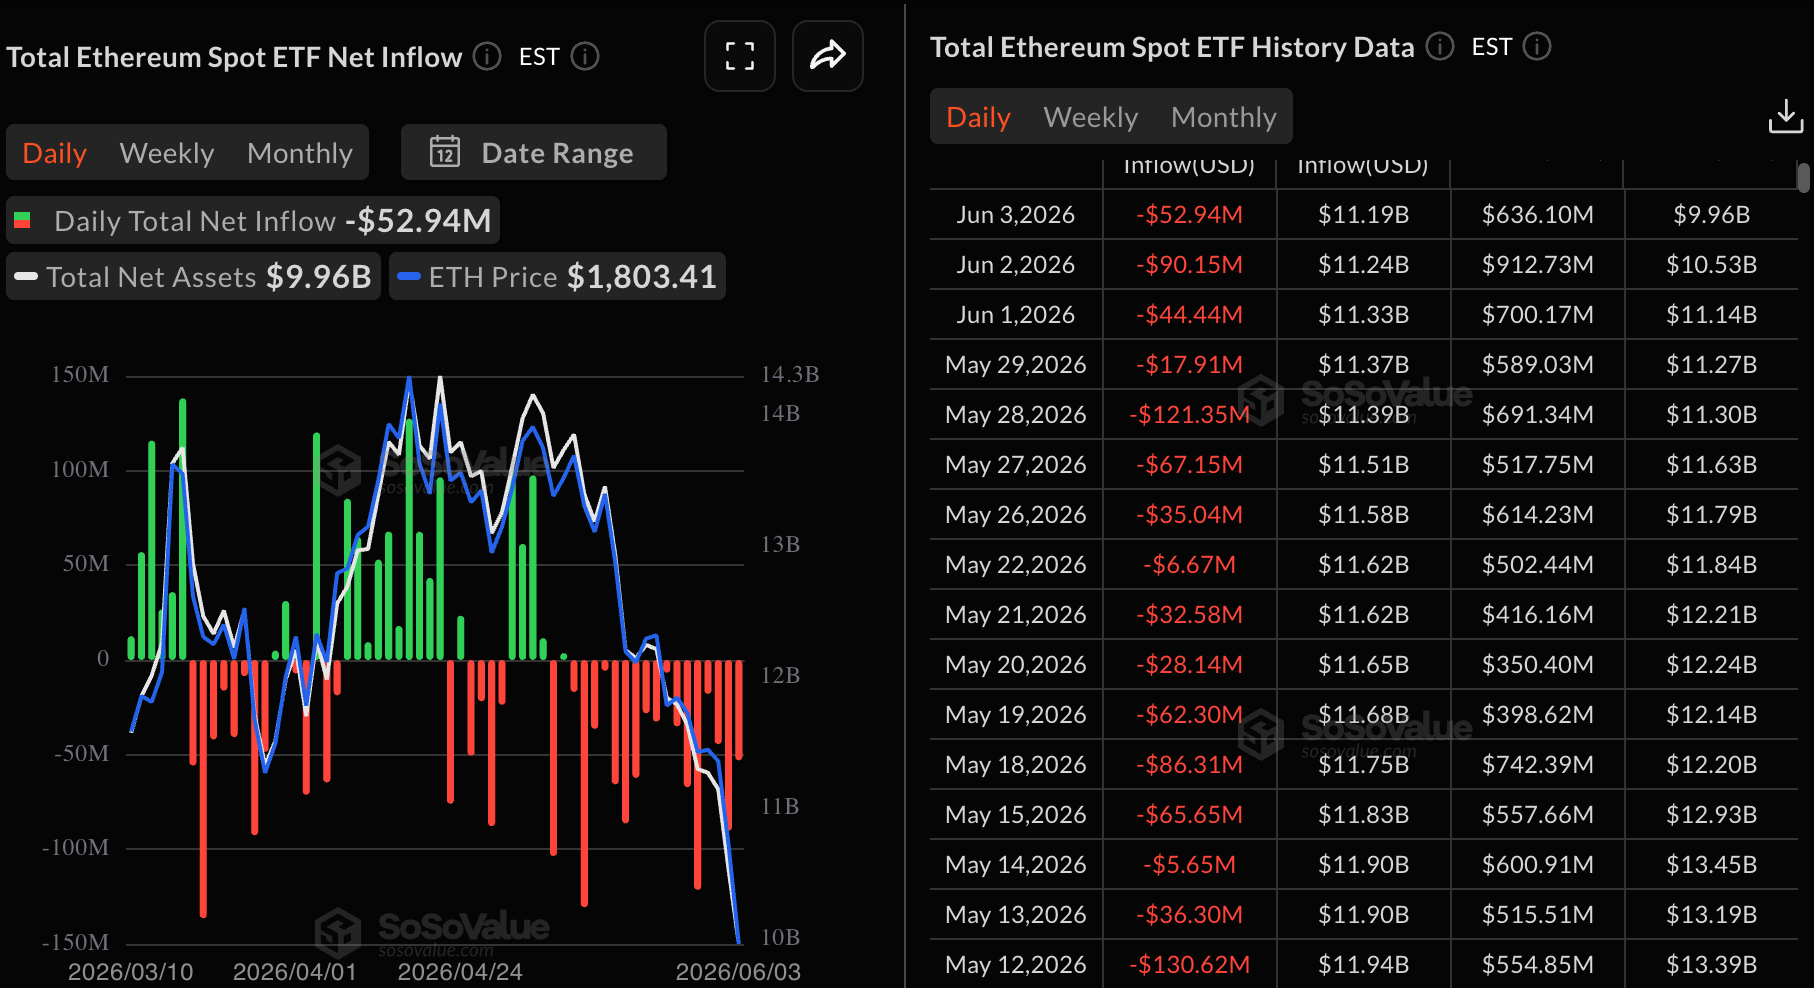
Institutional flows have also contributed to the current trend. According to SoSoValue data, U.S. spot Ethereum ETFs recorded sixteen consecutive days of net outflows, which marks the longest withdrawal streak since launch in July 2024.
At the same time, long-term holders have begun to move assets. Santiment data shows spikes in the Age Consumed metric over recent days. This metric tracks movements of previously inactive tokens. The increase signals that long-term holders have started to distribute.
Realized profit and loss data indicates that much of the recent selling comes from underwater positions. Losses have accumulated steadily since April, which suggests that some holders have chosen to exit during continued weakness.
On the derivatives side, open interest remains above 15 million ETH, while funding rates stay positive. CryptoQuant analyst Arab Chain described the imbalance between bullish positioning and falling prices.
"The rise in funding rates to these levels suggests that many traders anticipate a near-term price rebound, prompting them to increasingly enter long positions. However, this optimism coincides with Bitcoin's continued decline and the overall weakness in the market, creating a discrepancy between price action and trader behavior in the derivatives market," Arab Chain said.
He also warned that crowded long positions could increase volatility if prices fall further.
Treasury losses and risk levels remain in focus
Corporate exposure to Ethereum has also come under pressure. Lookonchain reported that Nasdaq-listed FG Nexus purchased 50,770 ETH for about $196 million in 2025 at an average price near $3,860. The firm later sold 36,025 ETH at an average price of about $2,330, recovering $83.92 million.
FG Nexus is down over $85M on its #Ethereum treasury bet!
— Lookonchain (@lookonchain) June 4, 2026
FG Nexus bought 50,770 $ETH($196M) at an average price of $3,860 in Aug–Sep 2025.
Then started selling in Nov 2025, selling 36,025 $ETH($83.92M) at an average price of $2,330.
Total loss: $85M+.https://t.co/ot97old74T pic.twitter.com/ysWdm4JW5u
Cumulative losses from that strategy have exceeded $85 million.
Other firms have reported similar pressure. SharpLink disclosed $506.7 million in unrealized losses and a $191.7 million impairment charge tied to ETH holdings during the first quarter.
These developments highlight the gap between long-term positioning and short-term price performance.
Outlook depends on key levels
Ethereum now faces a critical test around $1,700. A sustained hold above that level could stabilize price action and allow a move back toward $1,825. A stronger recovery would require a return above $2,000 and the $2,022 resistance zone.
If support fails, attention shifts toward $1,500 and potentially $1,400, where Ethereum found a base in April 2025.
Market participants continue to watch whether oversold conditions lead to a short-term bounce or if selling pressure extends the current trend.

Disclaimer: All materials on this site are for informational purposes only. None of the material should be interpreted as investment advice. Please note that, despite the nature of much of the material created and hosted on this website, HODL FM operates as a media and informational platform, not a provider of financial advisory services. The opinions of authors and other contributors are their own and should not be taken as financial advice. If you require advice, HODL FM strongly recommends contacting a qualified industry professional.