






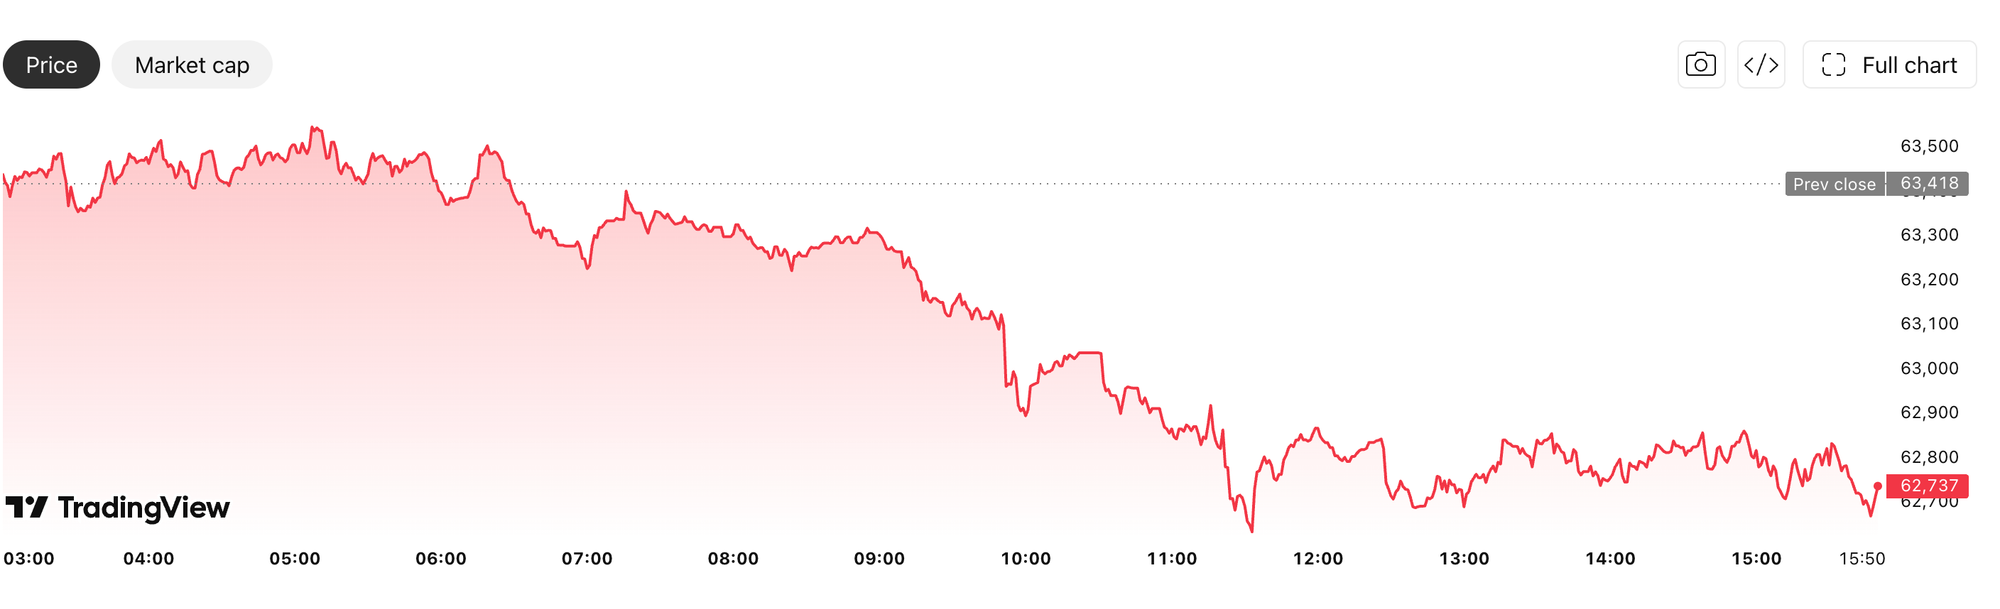
Bitcoin traded around $62,700 on Friday, down more than 3% in the week, stuck below the $64,000 level where its volume point of control and broken pitchfork structure converge.
A gradual cleanout takes shape on Binance
CryptoQuant community analyst BorisD published observations Thursday that put the focus on Binance open interest, which climbed to $8.15 billion on Wednesday. That OI buildup happened over weeks while Bitcoin held a narrow range since June, a period in which futures activity grew dominant as spot traders stepped aside.
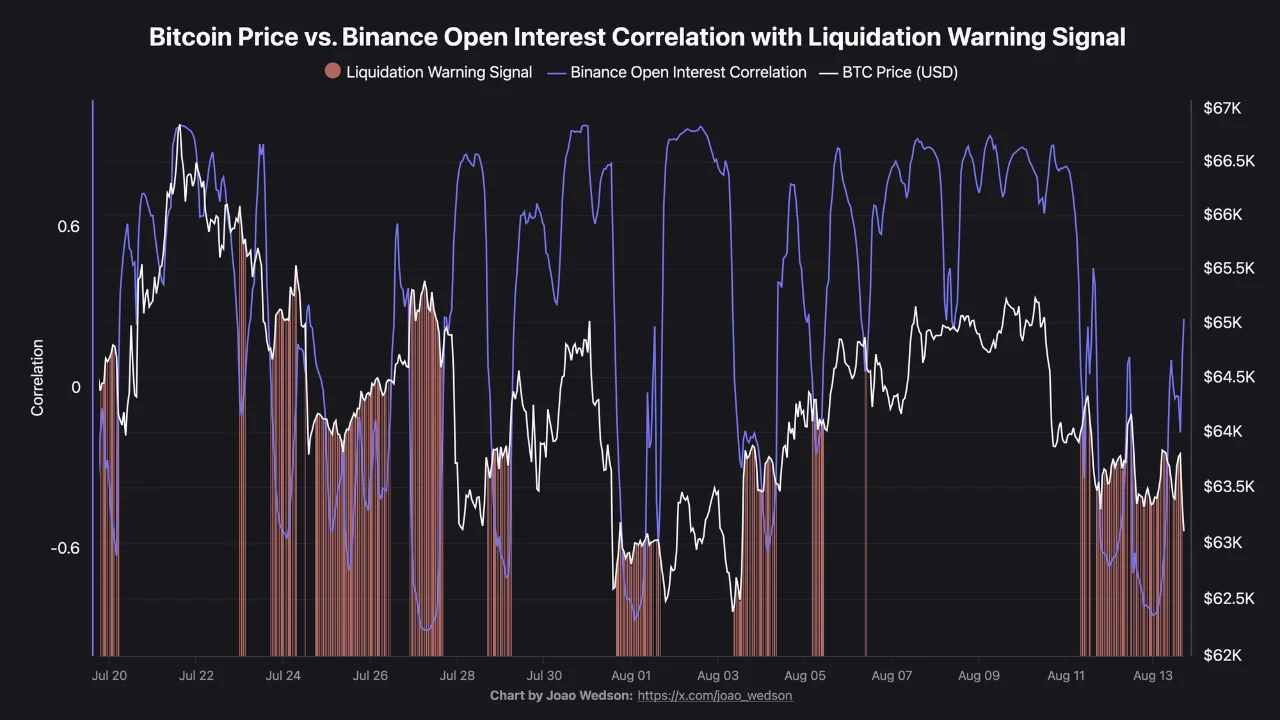
When price began to slide, the OI-price correlation initially turned negative. Open interest kept rising despite falling prices, a pattern BorisD described as a double-sided squeeze.
"In the Bitcoin market, the Binance Open Interest (OI) Correlation and liquidation warning signals clearly reveal the process of leveraged positions being flushed out. Initially, as the price fell, the correlation shifted to the negative side, indicating that OI was rising despite declining prices," BorisD wrote on CryptoQuant. "This showed a double-sided squeeze and [an] increasingly complex liquidity structure - driven by long positions trying to buy the dip on one end, and additional short positions entering the market on the other."
The correlation has since moved into positive territory at a reading of 0.25, with price and OI now falling in tandem. That shift is what BorisD said he had been waiting to see since last week.
"The simultaneous drop in both price and OI indicates that leveraged long positions are giving up, getting stopped out, or facing liquidation," he wrote.
CoinGlass data put total 24-hour cross-crypto liquidations at $253 million. BorisD had previously flagged the Monthly Open as the first downside target after Bitcoin failed to hold above $65,000. If buyers prove insufficient there, he described the $61,000 region as the next step, with the $57,000 zone below that, where he places the largest liquidity pool. With trading volume low, he wrote that Bitcoin moving step-by-step by generating liquidity along the way "appears to be the most reasonable scenario."
Geopolitical risk and ETF outflows add to the pressure
The week brought pressure from outside crypto markets as well. US Treasury Secretary Scott Bessent told reporters Thursday that Washington would "apply measures like have never been seen in the history of economic isolation on a country" against Iran, according to Reuters. The Strait of Hormuz standoff kept a war-risk premium alive in global markets and supported the US dollar, both of which weigh against risk appetite for assets like Bitcoin.
SoSoValue data showed spot Bitcoin ETFs recorded net outflows of $332.02 million through Thursday. A negative weekly total would mark a visible pullback in institutional participation at a time when price is already struggling to find a floor.
Macro data cooled, but Bitcoin did not respond
US Consumer Price Index data released Wednesday showed headline inflation at 3.4% year-over-year in July, down from 3.5% the prior month. Core CPI rose 0.2% monthly and 2.5% annually. Thursday's Producer Price Index came in flat against a 0.2% forecast, with the yearly rate falling to 4.7% from 5.5%.
Chicago Fed President Austan Goolsbee said recent price pressures are largely driven by temporary tariff and energy-related factors, favoring patience over aggressive tightening. Cleveland Fed President Beth Hammack argued further rate increases may still be needed to secure price stability. Fed funds futures put the probability of a year-end rate hike at just over 65%, down from nearly 85% the prior week.
Technical levels where buyers need to show up
Bitcoin's daily spot chart shows the asset has slipped below the lower boundary of the rising pitchfork channel that formed during the rebound from Bitcoin's early-August low. It also sits below the $64,000 point of control, the price where the greatest volume traded across the broader range. Those two breaks together move the burden of proof back to buyers.
On the weekly chart, the Relative Strength Index reads 38, with a mild upward tilt toward the neutral 50 level. The 200-week Simple Moving Average sits at $63,998. A weekly close below it would expose trendline support near $60,000. The yearly low of $57,800, set on July 1, sits further below that.
For near-term structure to repair, Bitcoin needs to close and hold above $64,000 across multiple sessions. That level lines up with both the broken pitchfork boundary and the volume point of control, with the 50-day exponential moving average at $64,458 clustered in the same region. A sustained close above that zone would also bring the 100-day exponential moving average at $66,589 and horizontal resistance at $66,500 into view.
 Jordan V.
Disclaimer: All materials on this site are for informational purposes only. None of the material should be interpreted as investment advice. Please note that, despite the nature of much of the material created and hosted on this website, HODL FM operates as a media and informational platform, not a provider of financial advisory services. The opinions of authors and other contributors are their own and should not be taken as financial advice. If you require advice, HODL FM strongly recommends contacting a qualified industry professional.