

Ethereum is approaching a critical technical moment as it trades near the $2,300 level, with price action compressed beneath a well-established resistance zone at $2,400. Market data and chart structure point to a prolonged standoff between buyers and sellers, with repeated failures at this level shaping the short-term outlook.
According to TradingView data, Ethereum has tested the $2,400 resistance at least four times over the past six weeks. Each attempt has met strong selling pressure, reinforcing the level as a major barrier. The zone carries added weight due to the overlap between the upper boundary of a descending channel and the 100-day moving average, both of which continue to cap upward momentum.
Price structure on the daily chart shows a market that lacks clear direction but continues to compress. Ethereum remains confined within a broader range between roughly $2,000 and $2,400, a pattern that has persisted for more than two months. The descending channel that began earlier this year still defines the macro trend, while overhead resistance from both the 100-day and 200-day moving averages continues to limit upside attempts.
Higher lows signal accumulation beneath resistance
Despite repeated rejections, the structure of recent pullbacks presents a more constructive picture. Ethereum has formed a sequence of higher lows over the past several weeks, with support levels rising from $2,000 to $2,100 and more recently near $2,200. This gradual shift suggests steady accumulation beneath resistance rather than outright weakness.
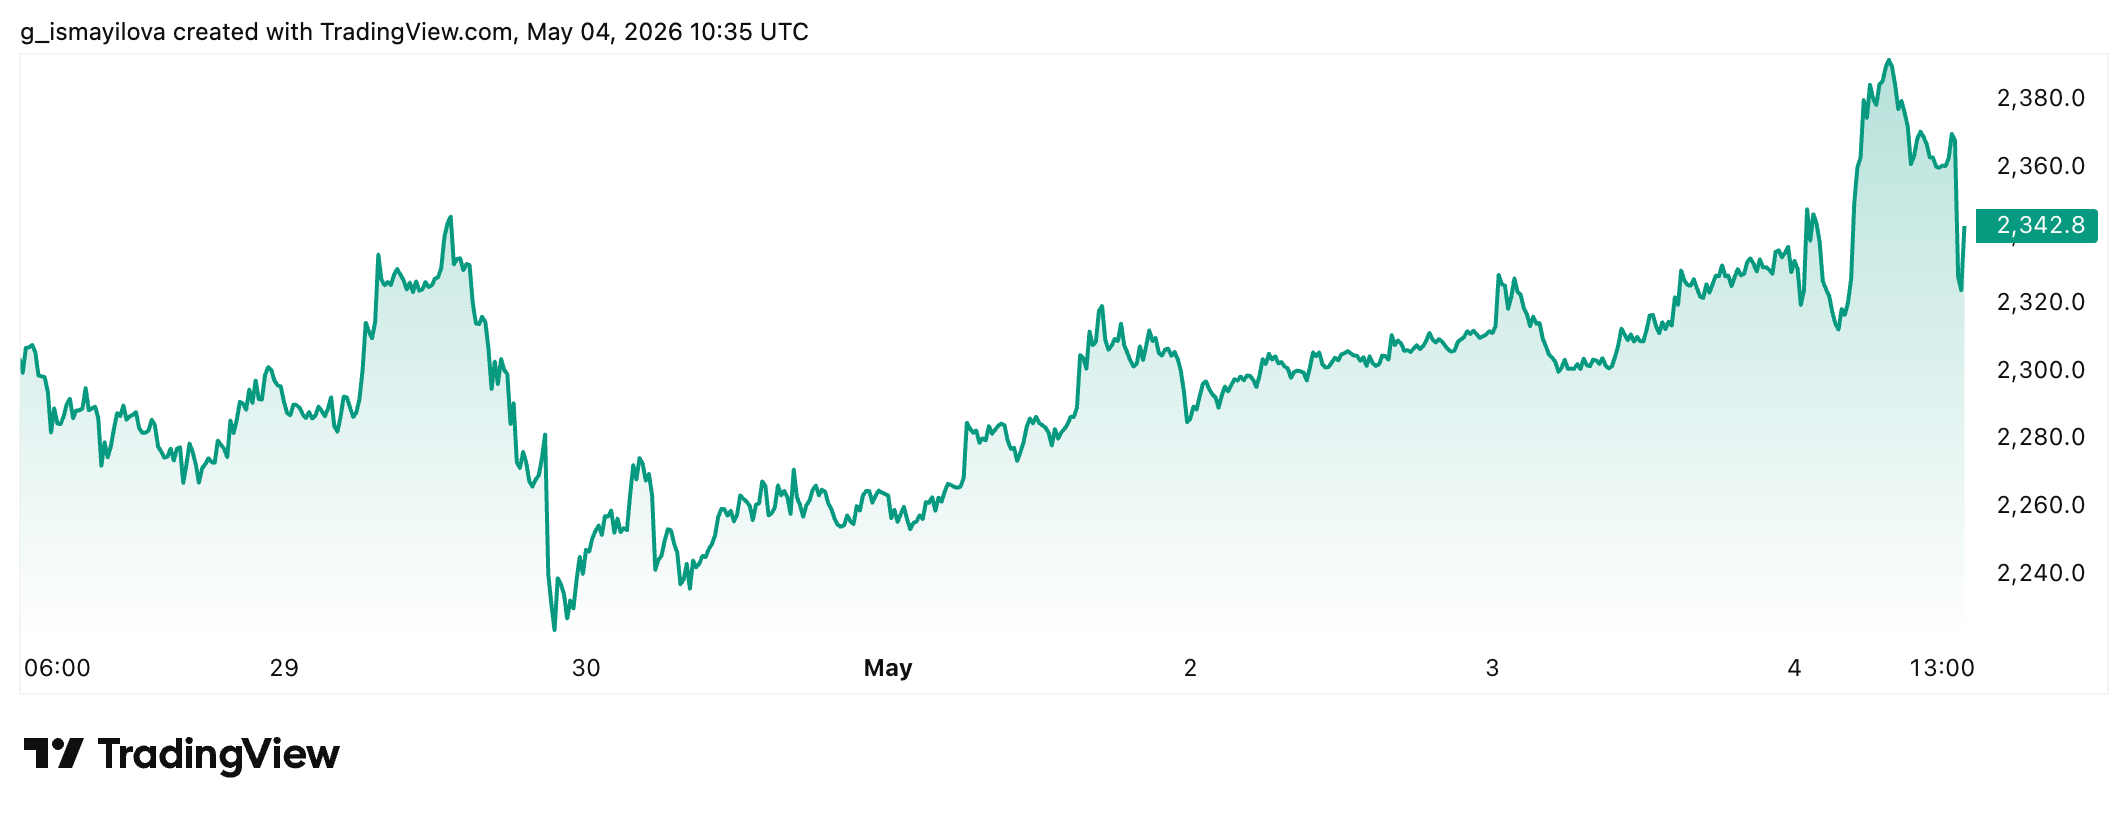
On lower timeframes, the 4-hour chart highlights an ascending trendline that has provided dynamic support since late March. Price currently sits close to that trendline near $2,350. As long as this structure holds, the short-term bias remains tilted toward another attempt at the $2,400 level and could push to the 2,500 zone, per crypto analyst Ted Pillow. A break below it would expose downside levels between $2,300 and $2,200.
$ETH tried to break above the $2,400 level but failed.
— Ted (@TedPillows) May 4, 2026
This is an important zone for Ethereum.
A reclaim above this level could push ETH above the $2,500 zone.
A rejection means ETH will drop below the $2,300 level again. pic.twitter.com/1dgZGsibgM
Momentum indicators add to the mixed picture. The relative strength index remains above 50 on shorter timeframes, which points to underlying buying pressure. Derivatives data shows a market that lacks strong conviction.
Derivatives data reflects market uncertainty
Funding rates for Ethereum have shifted notably since the February correction. During the 2025 rally, funding remained consistently positive as bullish sentiment dominated. That trend weakened after the market reversal earlier this year.
Recent data shows funding rates fluctuating between modestly positive and negative levels, with current readings near neutral territory. This contrasts with Bitcoin, where funding has remained more deeply negative. The divergence suggests Ethereum traders have not adopted aggressive directional positioning.
The absence of extreme funding levels indicates limited short squeeze potential compared to Bitcoin. It also reflects a market that has yet to commit to a clear trend.
Technical indicators point to potential breakout scenario
Additional signals suggest that a breakout attempt could develop if resistance weakens. Data highlights a potential bullish MACD crossover on the daily chart, a signal that has historically preceded upward price moves. The last similar crossover led to a rally of nearly 25% within a month.
Ethereum also trades near the 61.8% Fibonacci retracement level around $2,381, where buyers have shown consistent interest. The Supertrend indicator has remained positive since mid-March, which supports the broader uptrend despite recent consolidation.
On-chain metrics provide further support for a constructive scenario. Exchange reserves have dropped to multi-year lows, which points to reduced sell-side pressure. SoSoValue data shows Ethereum exchange-traded funds recorded more than $100 million in net inflows in recent sessions, reversing a short streak of outflows.
Downside risks remain if resistance holds
Failure to break above $2,400 could shift momentum back toward sellers. Repeated rejections at the same level often strengthen resistance and weaken bullish sentiment. In that scenario, a move below $2,200 would likely open the path toward the $2,000 psychological level.
A deeper correction could extend to $1,800, an area that has previously acted as a strong support zone. A breakdown toward that level would keep the descending channel intact and delay any broader recovery.
The weekly chart reinforces the importance of the current resistance band. Ethereum has struggled to reclaim key moving averages in the $2,430 to $2,460 range, where selling pressure has consistently emerged. Until price closes decisively above this region, the broader trend remains uncertain.
Broader market implications
Ethereum’s price action continues to influence the wider altcoin market. A confirmed breakout above $2,400 could trigger renewed momentum across major digital assets, including Solana, Cardano, and Chainlink.
A rejection, however, could lead to a broader pullback across the sector, as Ethereum often acts as a directional signal for altcoins.
For now, price remains locked within a narrowing range. The next decisive move above resistance or below support will likely define the short-term trend and set the tone for the crypto market in the coming weeks.

Disclaimer: All materials on this site are for informational purposes only. None of the material should be interpreted as investment advice. Please note that, despite the nature of much of the material created and hosted on this website, HODL FM operates as a media and informational platform, not a provider of financial advisory services. The opinions of authors and other contributors are their own and should not be taken as financial advice. If you require advice, HODL FM strongly recommends contacting a qualified industry professional.