

Bitcoin closed the first quarter of 2026 with its sharpest decline in years, as macro pressure, geopolitical tension, and shifting investor behavior weighed on the broader crypto market.
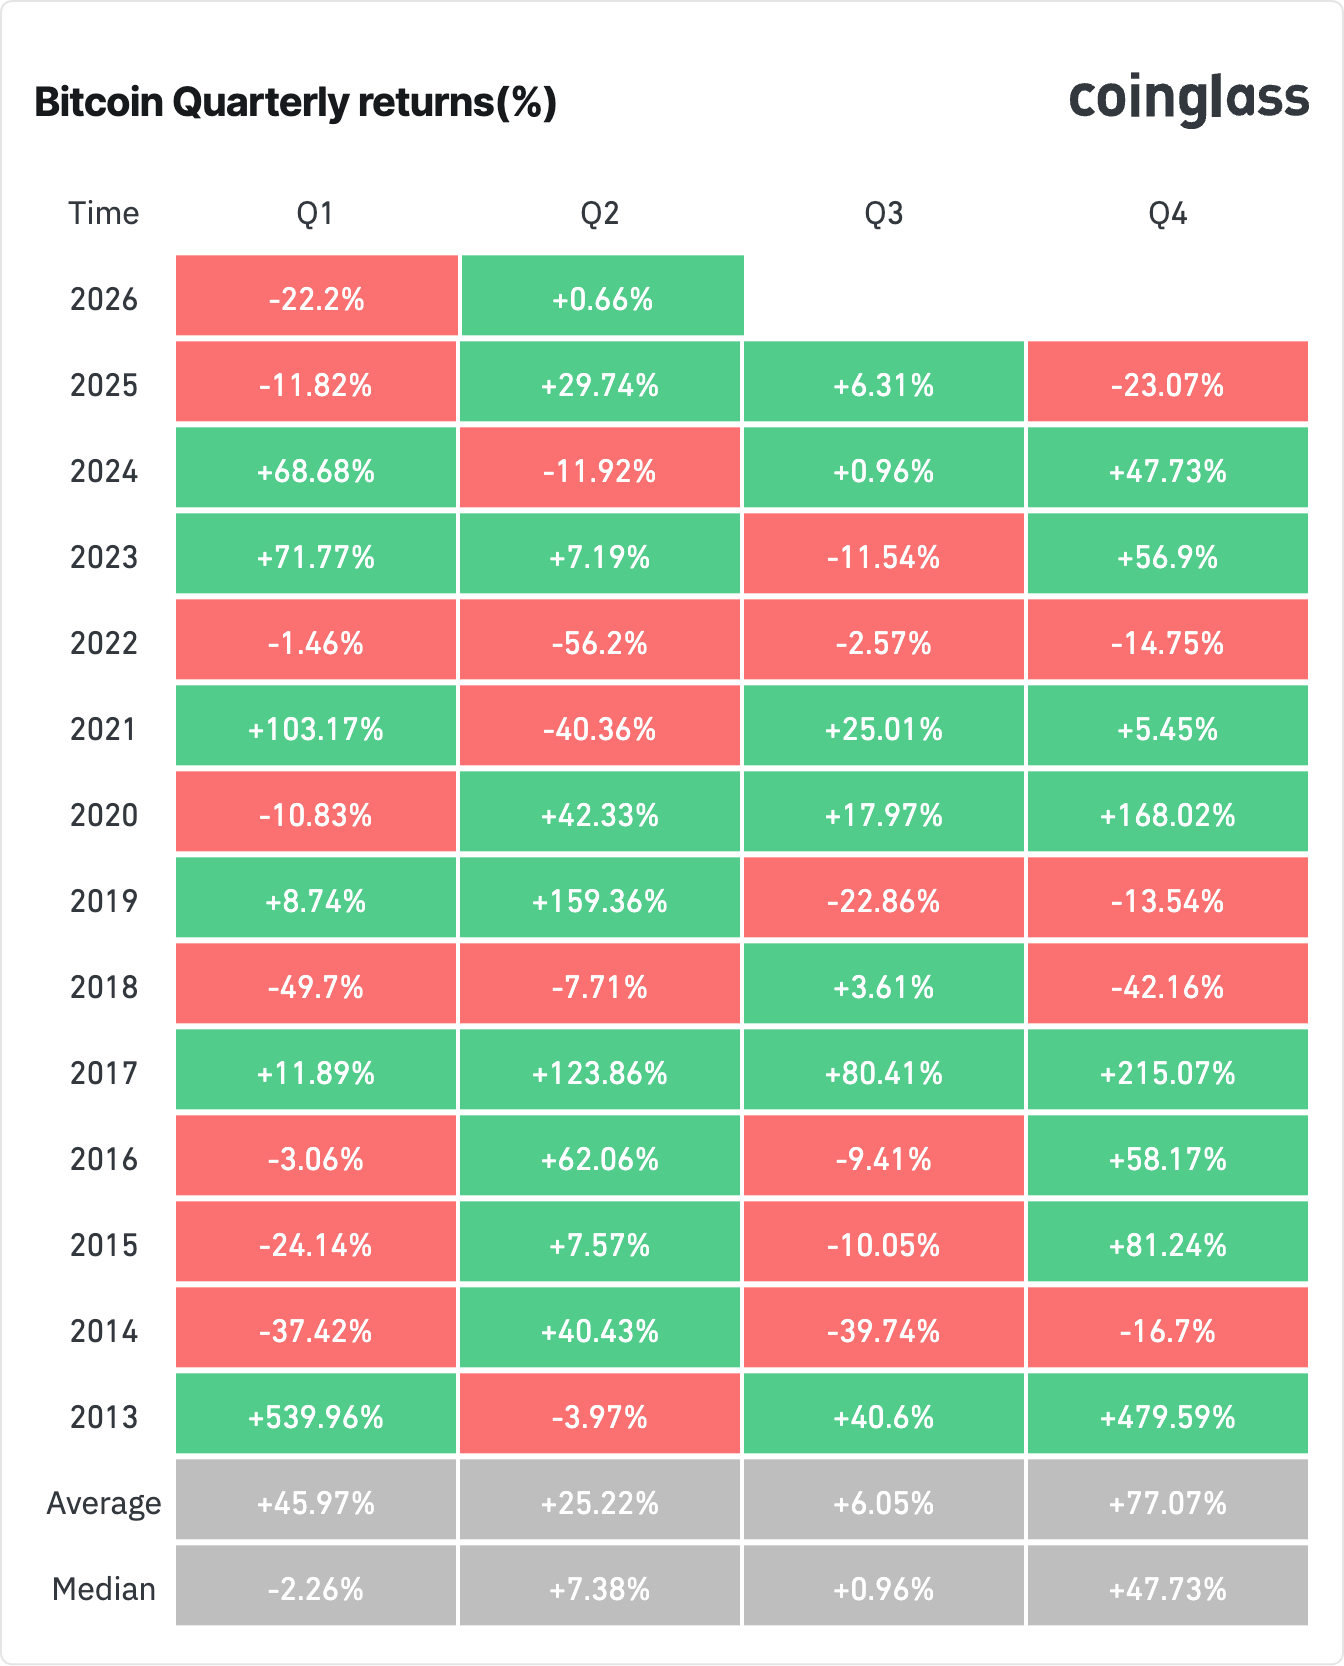
CoinGlass data shows that Bitcoin fell 22.2% in the first three months of the year, ending March at $66,619 after starting at $87,508. This marks the weakest first-quarter performance since 2018, when the asset dropped by half during the same period.
The recent decline extends losses from late 2025. Bitcoin fell 23.07% in the fourth quarter, which brings the total six-month drawdown to more than 45%. The correction coincided with rising instability in the Middle East and a shift in global risk appetite.
Geopolitics and macro pressure weigh on crypto
Tensions linked to the U.S. and Iran conflict have played a central role in recent market behavior. Oil prices surged after disruptions in the Strait of Hormuz, a key global shipping route. Investors reduced exposure to risk assets during that period and moved capital into traditional safe havens.
U.S. President Donald Trump said the military campaign against Iran could end within weeks.
“I had one goal: They will have no nuclear weapons, and that goal has been attained,” Trump said during remarks at the White House. He added that the operation could conclude “within maybe two weeks.”
The comments shifted expectations across markets. Oil prices declined by about 4% shortly after reports of a potential de-escalation. Crypto assets and equities also moved higher during the same window.
The S&P 500 rose 2.91% in the latest session, while the Dow Jones Industrial Average gained 2.49%, according to Google Finance data.
Short-term recovery emerges across crypto assets
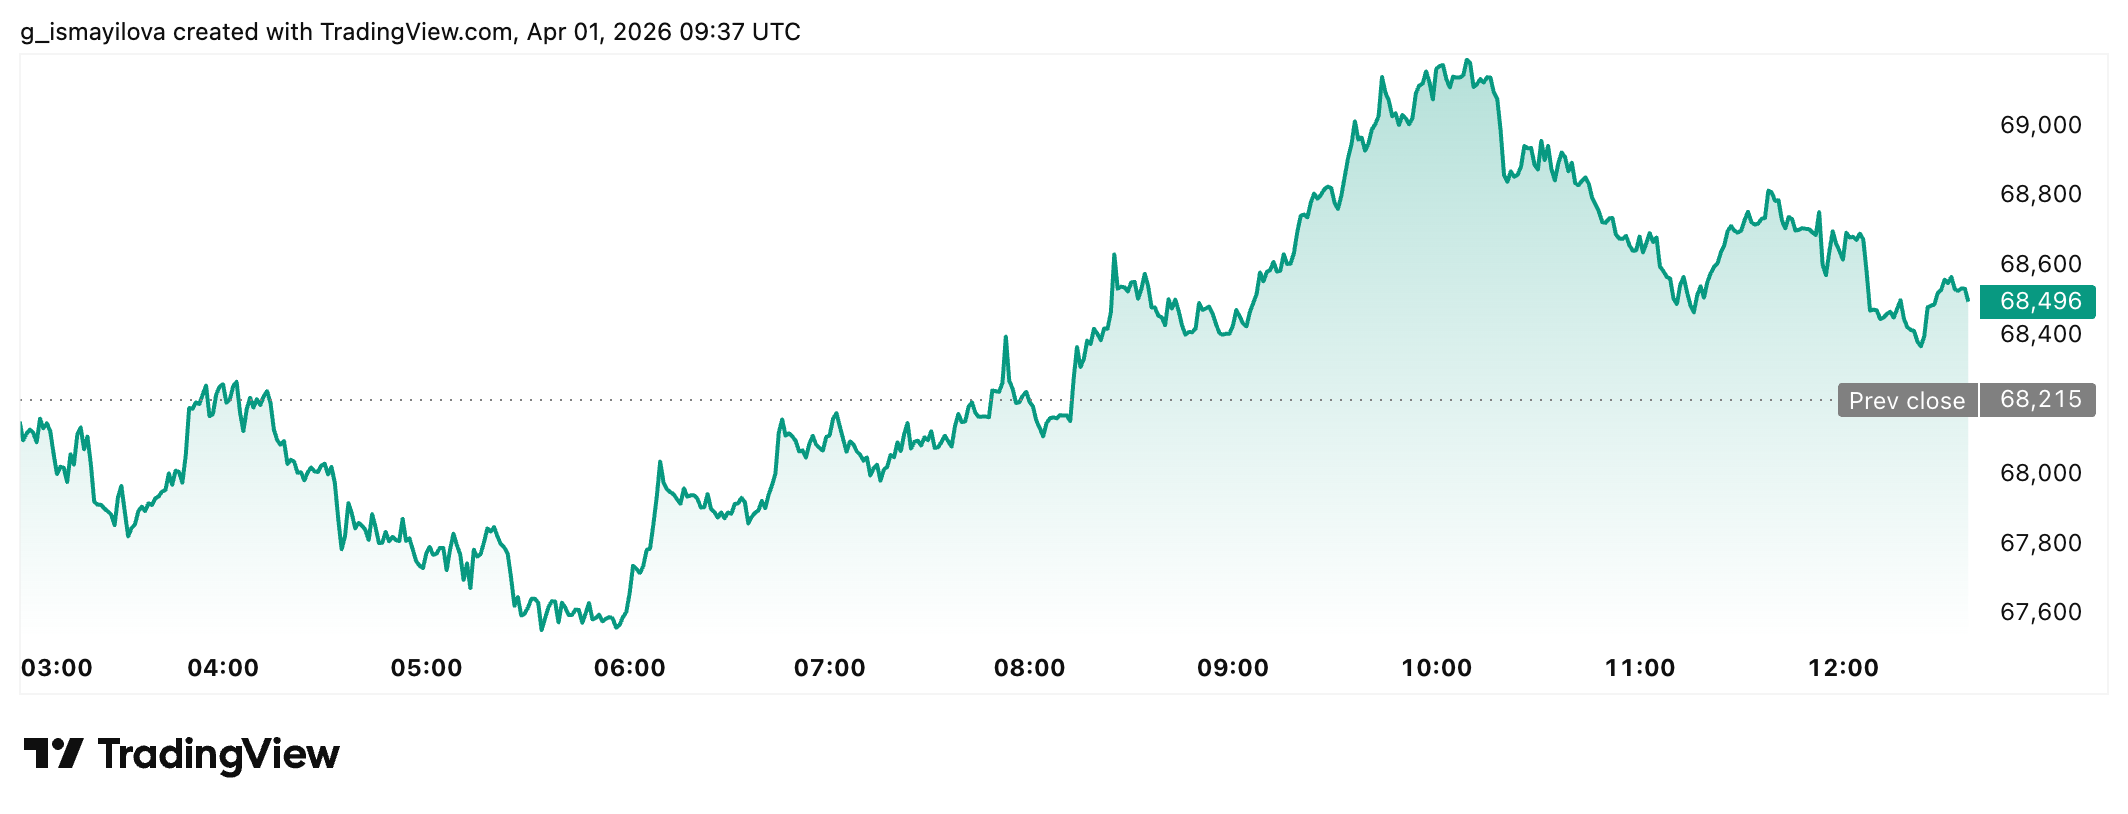
TradingView data shows Bitcoin rebounded above $69,000, its highest level in nearly a week. Ethereum moved back above $2,100, while assets such as XRP, Solana, and Dogecoin recorded moderate gains.
Some altcoins outperformed the broader market. Algorand climbed more than 20%, while Zcash and other mid-cap tokens posted smaller but notable increases.
The move higher coincided with a short squeeze in derivatives markets. Data from CoinGlass shows more than $200 million in short positions were liquidated within 24 hours. This forced buying activity added momentum to the price rebound.
Exchange-traded fund flows also shifted direction. Spot Bitcoin ETFs recorded $117 million in net inflows over the past day, while Ethereum ETFs attracted $31 million. These inflows followed a weak first quarter that saw nearly $500 million in net outflows, based on SoSoValue data.
Sentiment remains fragile despite price bounce
Market sentiment has not recovered at the same pace as prices. The Crypto Fear & Greed Index remains at a level of 8, which signals “extreme fear.” The indicator has stayed in this range for most of the year.
Traders often interpret such readings as potential entry points. However, current conditions differ from previous cycles. Elevated interest rates and geopolitical risks continue to shape behavior across financial markets.
Posts shared by Rand Group on X highlight a gap between sentiment and price action. Fear has remained elevated due to war headlines and monetary policy concerns, yet selling pressure has not increased in proportion.
Longest extreme fear stretch in Bitcoin history. War in the middle east. Tariffs everywhere. And somehow we still at $67,000 pic.twitter.com/rSGgGnQIaQ
— Rand Group (@cryptorand) March 31, 2026
Onchain data points to accumulation phase
Blockchain data suggests a structural shift in market participation. The share of short-term holders has dropped to 3.98%, according to analysis cited from CryptoQuant. In previous cycles, similar levels aligned with periods near market bottoms.
Long-term holders now control a larger share of Bitcoin supply. This trend reflects reduced speculative activity and slower turnover in the market.
At the same time, large investors have increased their influence. The Bitcoin exchange whale ratio has risen above 60%, its highest level in a decade. Data shared by analyst CW8900 shows that retail participation has declined to its lowest level over the same period.
“In general, the bottom appears when the whale ratio is at its highest,” the analyst said.
Market direction remains tied to external signals
Bitcoin’s near-term direction depends on a combination of macroeconomic clarity, ETF flows, and geopolitical developments.
The recent rebound shows that sentiment can shift quickly when external pressure eases. However, underlying caution remains visible in investor behavior and positioning.
Onchain metrics suggest accumulation, while price action reflects uncertainty. The balance between these forces will shape how the market evolves in the coming months.

Disclaimer: All materials on this site are for informational purposes only. None of the material should be interpreted as investment advice. Please note that, despite the nature of much of the material created and hosted on this website, HODL FM operates as a media and informational platform, not a provider of financial advisory services. The opinions of authors and other contributors are their own and should not be taken as financial advice. If you require advice, HODL FM strongly recommends contacting a qualified industry professional.