

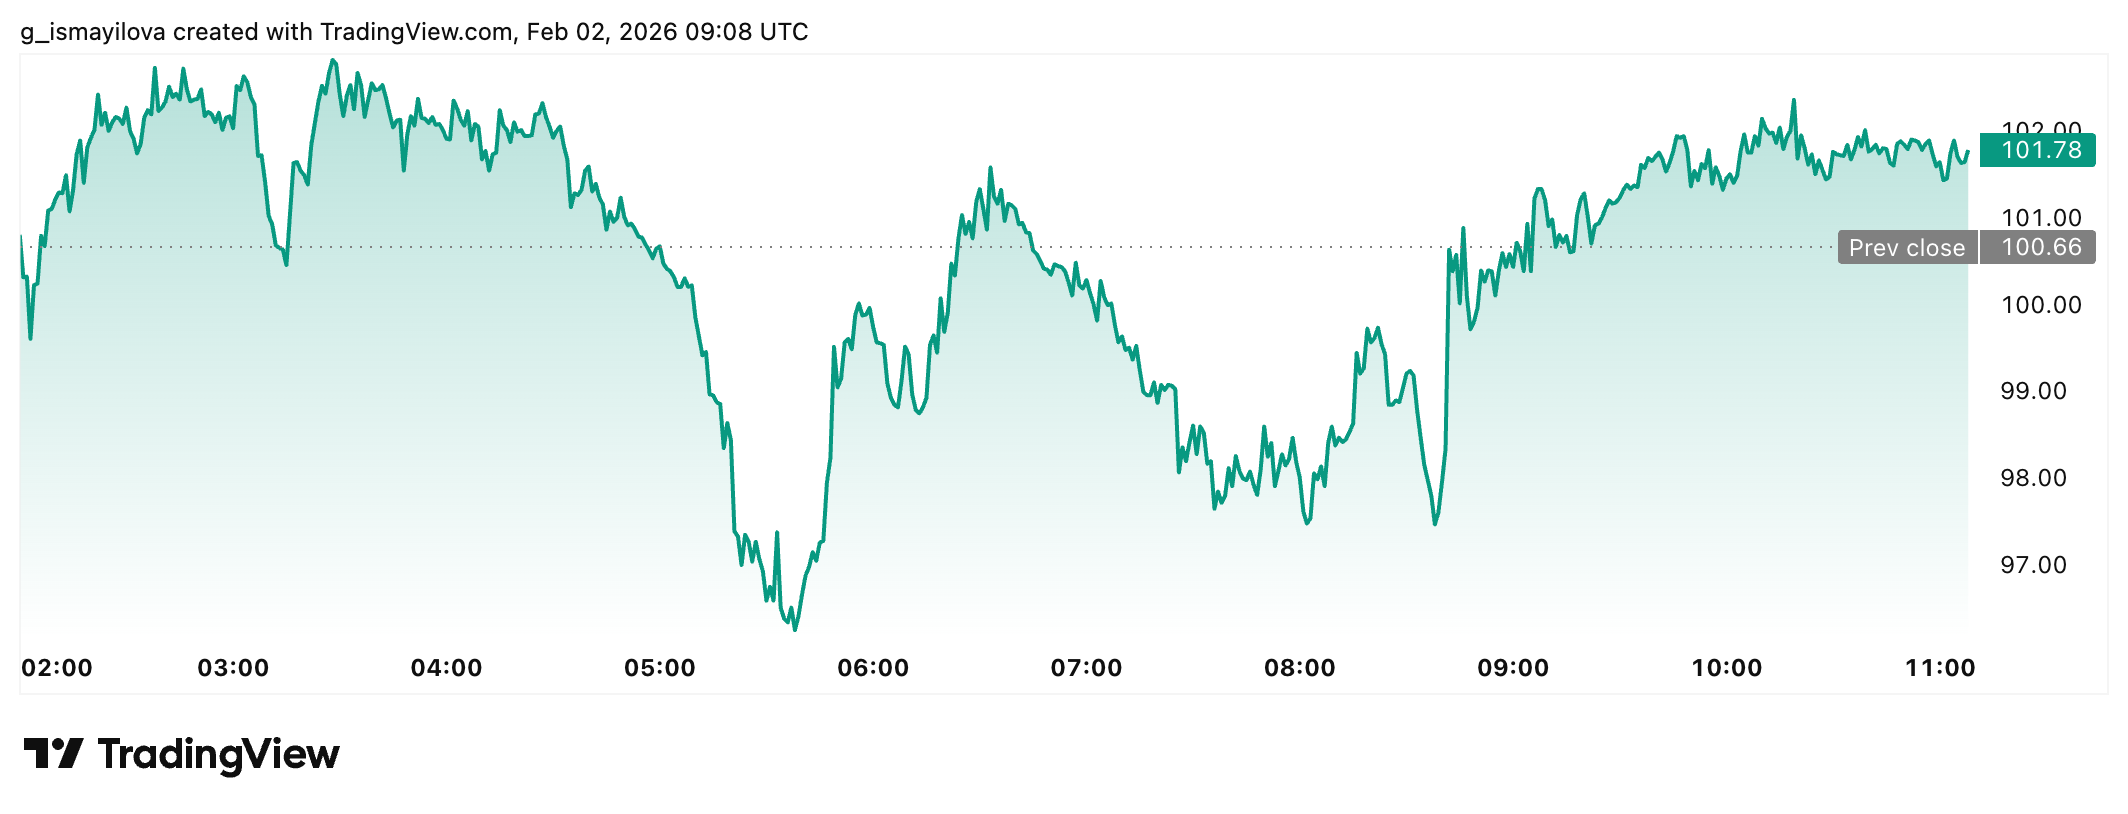
Solana’s price extended its correction on Monday, with SOL trading below the $100 psychological level after losing more than 15% over the previous week. The move marked one of the sharpest weekly declines for the token in recent months and placed renewed focus on derivatives positioning, institutional flows, and broader macro pressure across the crypto market.
Solana fell near $96, but at the time of reporting, it's trading around $102, following a rejection at the $126.65 weekly resistance earlier in the week. Market structure weakened quickly after that rejection, with sellers maintaining control through the weekend.
Derivatives data reflects growing downside bias
Derivatives metrics point toward a bearish short-term outlook. According to Coinglass, Solana’s OI-weighted funding rate flipped negative on Saturday and stood at -0.0080% on Monday. A negative funding rate shows that short positions pay long positions, which signals stronger conviction among traders who expect further downside.
The long-to-short ratio reinforces that view. Coinglass data showed a ratio of 0.97 on Monday. A reading below one indicates that short positions outnumber long positions, a common sign of risk-off sentiment in perpetual futures markets.
While bearish positioning increased, overall derivatives activity declined. CoinGlass data showed that total derivatives volume dropped 21% to $19.26 billion, while open interest fell 5% to $6.15 billion. This pattern suggests long positions closed rather than aggressive new short exposure.
Spot ETF flows show first weekly outflow
Institutional demand for Solana also weakened last week. Data from SoSoValue showed that spot Solana exchange-traded funds recorded a net outflow of $2.45 million, which marked the first weekly withdrawal since these products launched.
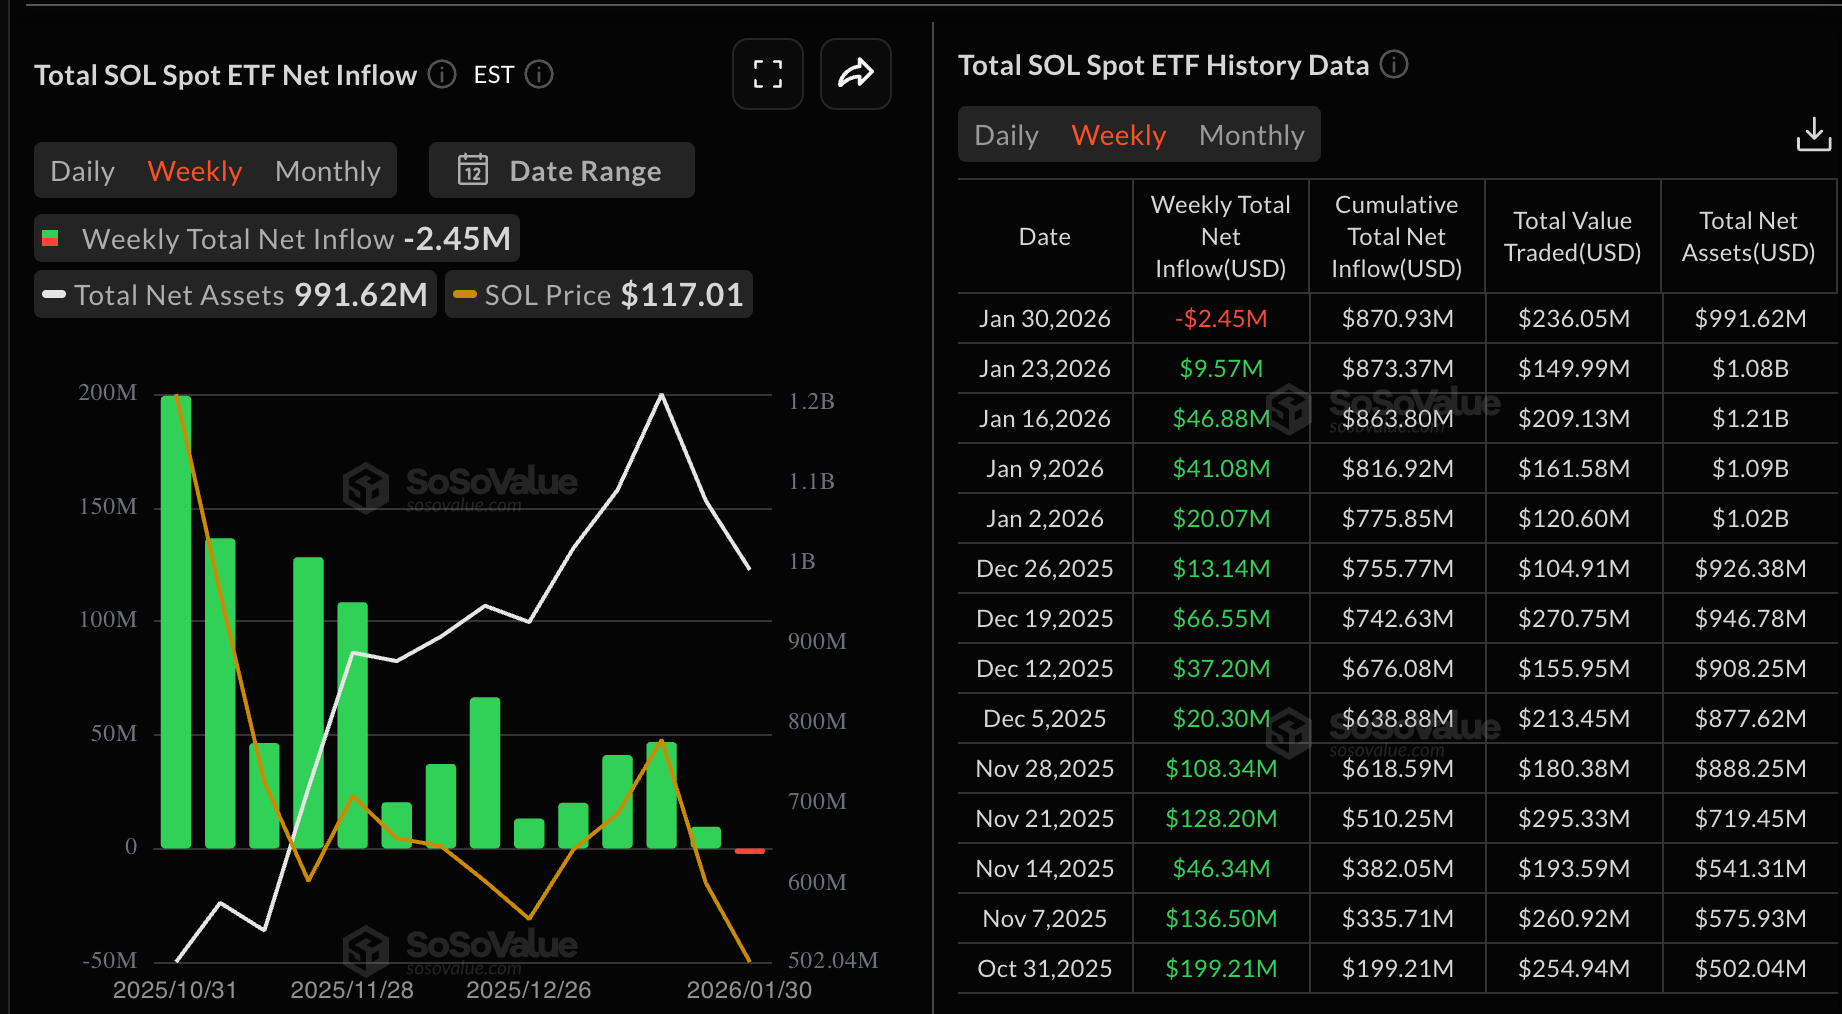
The outflow contrasted with stronger demand earlier in the year. U.S. spot Solana ETFs recorded $104 million in net inflows during January, even as Bitcoin and Ethereum products saw net outflows during the same period. Last week’s reversal suggested a more cautious stance from institutional participants after SOL failed to hold key resistance levels.
If ETF outflows continue, price pressure could persist, especially while derivatives sentiment remains negative.
Price action confirms technical breakdown
Solana’s daily chart shows a confirmed break below a major psychological and structural level. The decline below $100 followed a rejection at $126.65 and aligned with a broader pattern of lower highs and lower lows.
The daily Relative Strength Index dropped to around 25, which placed SOL in extreme oversold territory. Oversold conditions often precede short-term rebounds, but they do not confirm trend reversals on their own.
The Moving Average Convergence Divergence indicator showed a bearish crossover on January 19 and remained negative, with expanding red histogram bars below the neutral level. SOL also traded well below its declining 20-day and 50-day moving averages, which underscored the dominant bearish structure.
Bollinger Bands widened on the daily timeframe, with price action hugging the lower band. This setup typically reflects expanding volatility during strong directional moves.
Key levels remain in focus
A daily close below $100 opens the door toward the April 7 low at $95.26. A break below that level could expose the January 23, 2024 low near $79, which stands as a higher-timeframe support zone.
On the downside, around $90 is the next area of interest, followed by $85 and the broader $80 macro support level if selling pressure persists.
On the upside, Solana would need to reclaim $100 and hold above short-term moving averages to shift near-term momentum. The next major resistance remains the $126.65 weekly level, with higher resistance zones near the 50-day and 100-day exponential moving averages at $133 and $144.
Macro pressure weighs on sentiment
Broader market conditions also weighed on Solana. Over the weekend, forced liquidations swept across crypto markets, amplified by thin liquidity conditions.
Macroeconomic concerns resurfaced after President Trump nominated former Federal Reserve governor Kevin Warsh as the next Fed chair. Market participants widely viewed the pick as hawkish, which revived expectations of tighter U.S. monetary policy.
Geopolitical risks added further pressure. Reports of rising U.S.–Iran tensions pushed investors toward safer assets, with crypto markets once again showing sensitivity to global uncertainty.
Network fundamentals remain resilient
Despite price weakness, Solana’s on-chain activity continued to show strength. crypto.news reported on Feb. 1 that the network processed more than 2.34 billion transactions in January, a 33% increase. That figure exceeded combined transaction counts across Ethereum, Base, and BNB Chain.
The divergence between price performance and network usage highlighted a growing gap between market sentiment and underlying activity.
Outlook remains cautious
Solana’s current downside bias draws support from derivatives positioning, ETF outflows, and a confirmed technical breakdown below $100. Oversold conditions raise the chance of short-term relief moves, but the broader structure remains bearish until key resistance levels return.
Market participants continue to watch volume behavior and institutional flows for signs of stabilization. Until SOL reclaims broken support with conviction, downside risk remains the dominant factor in the near-term outlook.
Disclaimer: All materials on this site are for informational purposes only. None of the material should be interpreted as investment advice. Please note that despite the nature of much of the material created and hosted on this website, HODL FM is not a financial reference resource, and the opinions of authors and other contributors are their own and should not be taken as financial advice. If you require advice. HODL FM strongly recommends contacting a qualified industry professional.