

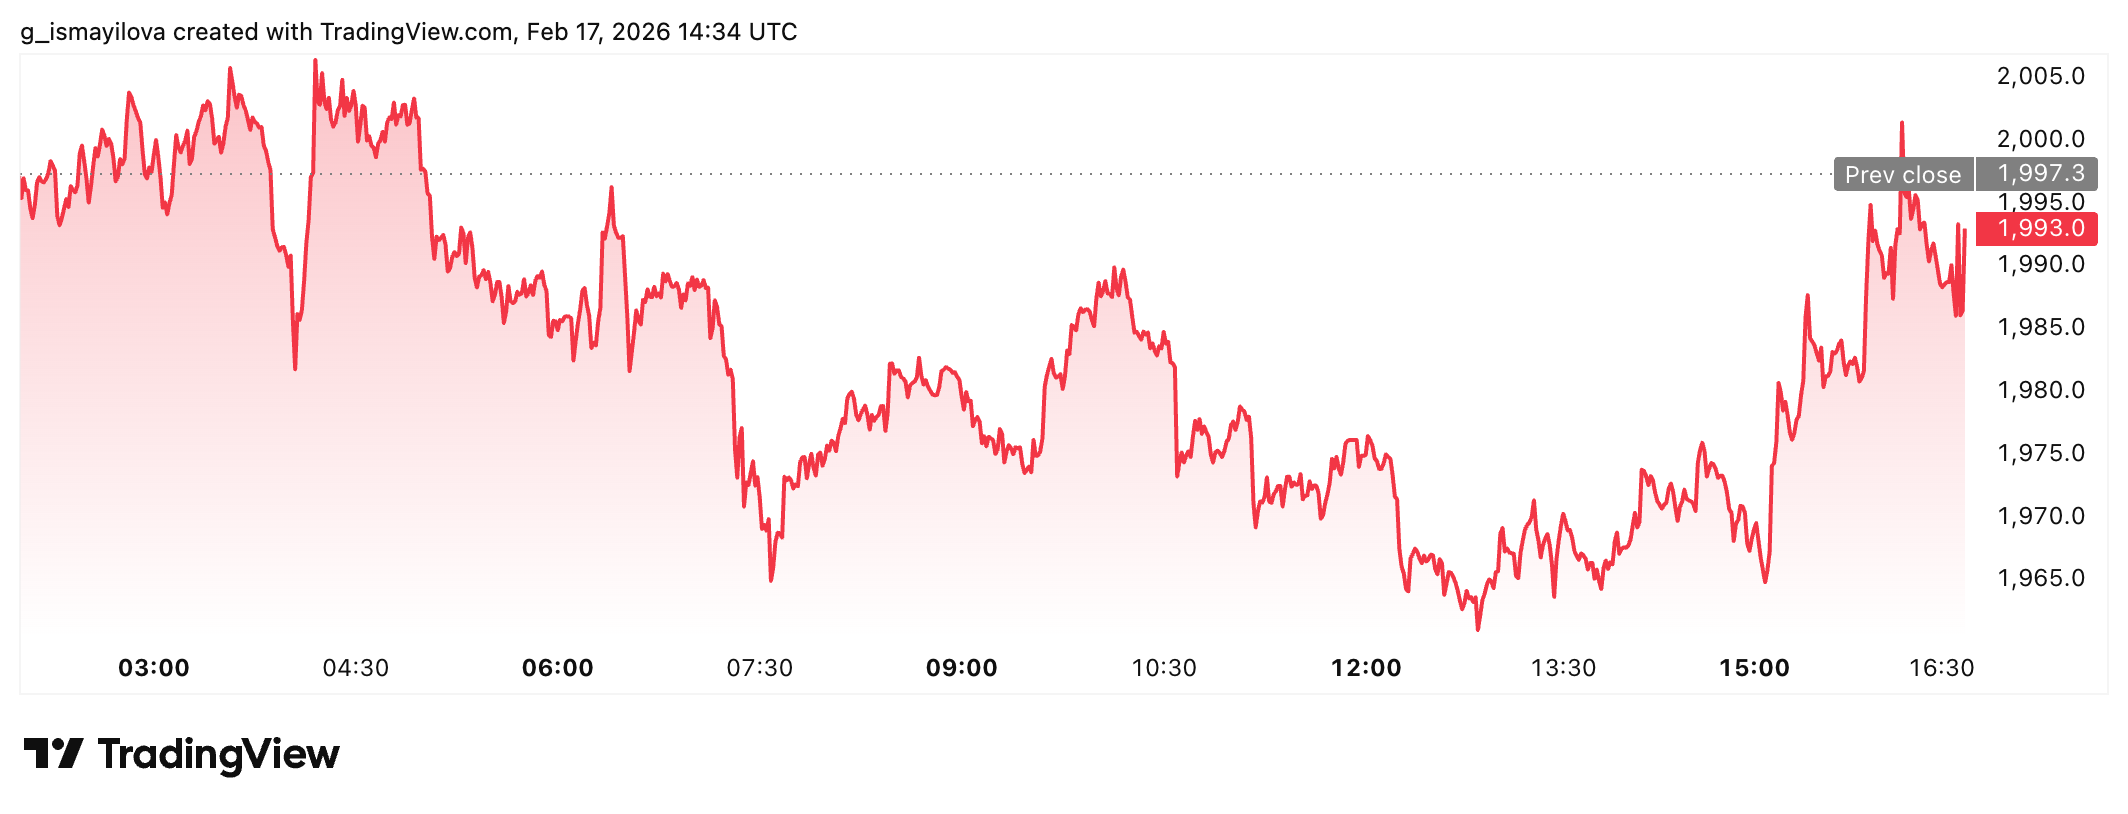
Ethereum trades below the $2,000 psychological level after weeks of volatility and consolidation. The asset moves within a tight band near $1,900–$2,100 after a sharp decline that erased much of the gains from last year. Recent prices hover near $1,981–$2,000, with short bursts toward $2,100 failing to hold, according to TradingView data.
Market structure shows a consolidation phase that began in early February. The lower boundary aligns with price levels last seen in May 2024, while the upper boundary reflects local highs from that same period before the rally toward nearly $5,000 in the summer of 2025.
Technical conditions reinforce the pressure. Ethereum would need to move above the 50 EMA near $2,600 and reclaim the resistance zone around $2,750 to reduce selling pressure. The next major barrier stands near $3,000–$3,100, where the 200 EMA converges.
Sharp decline reshapes market behavior
The recent sell-off marked one of the fastest declines in recent cycles. Ethereum lost about 40% in a few weeks and now sits roughly 60% below its August 2025 record high near $4,946. Spot trading volume dropped to about $22 billion in the last day, down more than 30% from the previous session.
Derivatives markets show similar caution. Data from CoinGlass recorded futures volume near $38 billion after a 5.7% decline, while open interest slipped to around $23 billion. Reduced open interest alongside muted price movement reflects lower risk exposure from traders.
On-chain data signals a colder market environment. Alphractal reported on Feb. 17 that Ethereum’s “Market Temperature” approaches cold territory based on MVRV Z-Score, RVT, and NUPL metrics. Similar readings in earlier cycles appeared during periods of subdued speculation and reset valuations.
Ethereum Market Temperature is near cold levels
— Alphractal (@Alphractal) February 16, 2026
The Market Temperature is a composite indicator combining:
• MVRV Z-Score (40%)
• RVT (30%)
• NUPL (30%)
It measures whether the market is overheated or oversold.
When it approaches zero or drops below, it signals that the… pic.twitter.com/MzOCZ3yUFg
Capitulation signals and long-term positioning
Tom Lee of BitMine described in the interview the current environment as one that may precede a market bottom. He referenced investor “rage quitting,” a phase where frustrated participants exit positions after steep declines.
Lee linked this behavior to previous cycles. He pointed to market downturns in 2018 and 2022, when widespread capitulation occurred before major recoveries. He noted that Ethereum fell below $2,000 after a steep decline and described the pattern as similar to earlier cycle resets.
BitMine holds a large Ethereum treasury and now faces roughly $7 billion in unrealized losses. Despite that exposure, the firm added 41,788 ETH on Feb. 3, 2026, as HodlFM reported. The purchase reflected conviction in long-term performance rather than a short-term reaction.
Lee framed the strategy around patience during volatile phases and confidence in recovery patterns. Past cycles delivered rallies after prolonged declines, according to his assessment of historical behavior.
Technical signals remain fragile
Chart structure shows lower highs and lower lows since the drop from above $3,000 earlier this year. The trend remains intact until a higher high forms. The 20-day moving average sits above the current price.
Momentum indicators reflect weak demand. The relative strength index moved into oversold territory near 20–25 before returning to the mid-30s. The indicator remains below 50, which keeps bearish momentum intact.
Support sits near $1,900. A breakdown below that level opens a path toward $1,750–$1,800 and potentially $1,600. Resistance stands at $2,150–$2,200, followed by $2,650 and $2,800. A daily close above the first resistance zone could shift momentum toward $2,400.
Market conditions evolve across cycles
Price consolidation and reduced speculative activity align with patterns from earlier downturns. Large holders maintain exposure despite unrealized losses. Liquidity and participation levels fluctuate across spot and derivatives markets.
The current phase combines technical pressure, cautious positioning, and long-term accumulation strategies from major holders.
Ethereum remains within a narrow trading range under $2,000. The next directional move depends on whether buyers defend support near $1,900 or whether sellers push the price toward deeper support zones.

Disclaimer: All materials on this site are for informational purposes only. None of the material should be interpreted as investment advice. Please note that, despite the nature of much of the material created and hosted on this website, HODL FM operates as a media and informational platform, not a provider of financial advisory services. The opinions of authors and other contributors are their own and should not be taken as financial advice. If you require advice, HODL FM strongly recommends contacting a qualified industry professional.