

Recent blockchain data highlights a structural difference between the two largest cryptocurrencies. Long-term holders of Ethereum move their assets at roughly three times the rate of Bitcoin investors, according to analytics shared by Glassnode.
The circulation pattern reflects how each network functions inside the broader digital asset ecosystem. Ethereum operates as infrastructure for decentralized applications. Bitcoin functions primarily as a store of value.
Glassnode described Bitcoin as a digital savings asset. The firm observed that many coins remain dormant for long periods. Recent supply trends show more Bitcoin leaving exchanges and entering long-term storage. Investors often treat the asset as a macro hedge rather than a transactional currency.
Ethereum displays a different pattern. Activity across decentralized finance, token trading, and smart contract execution creates steady demand for ETH inside the network. These interactions require ETH for gas fees. Each swap, stablecoin transfer, or smart contract call requires payment in the network’s native token.
Wallet growth highlights Ethereum’s broader adoption
Data from Santiment shows that Ethereum maintains a clear lead in total wallet holders. The network has about 182.7 million non-empty addresses. Bitcoin has roughly 58.5 million addresses with balances.
📈 This chart illustrates the past 10 years of the amount of holders across several of crypto's largest market cap assets. Ethereum's number of non-empty wallets has gone parabolic relative to other coins.
— Santiment (@santimentfeed) March 11, 2026
🧐 Keep tabs on this chart any time: https://t.co/d9ifPZqeGX pic.twitter.com/5kQSa4P3kd
Ethereum first surpassed Bitcoin in total wallet addresses in February 2019. The gap expanded during the following years as decentralized applications attracted new users.
DeFi platforms, NFT marketplaces, and tokenized asset systems rely on Ethereum infrastructure. Many services require users to create multiple wallets or interact with several smart contracts. This dynamic increases the number of active addresses compared with Bitcoin’s simpler payment model.
Bitcoin adoption follows a different trajectory. Investors often accumulate the asset and store it in cold wallets or custodial platforms. The behavior limits transaction turnover.
Network activity reaches new highs
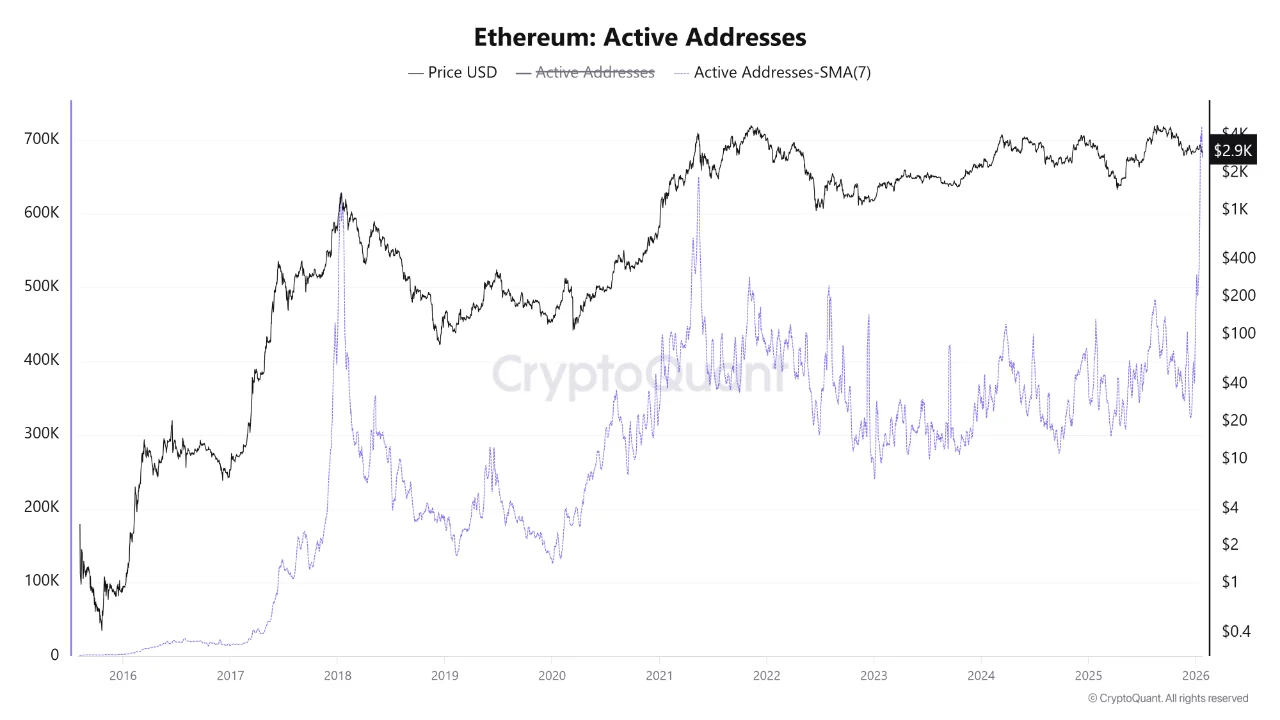
On-chain data also indicates rising activity on Ethereum’s base layer and scaling networks. A report from CryptoQuant noted that daily active addresses reached a high of 718K in February 2026. That level surpassed figures recorded during the peak of the 2021 DeFi and NFT cycle.
The 30-day moving average of daily active addresses reached about 837,200, according to Santiment data. The figure represents an increase of 82% compared with five years earlier.
Wallet creation also accelerated. New addresses appear at an average rate of about 284,800 per day. The figure reflects a 64% increase from five years ago.
Transaction demand extends beyond Ethereum’s main chain. Layer 2 scaling networks now process large volumes of activity. Combined Layer 1 and Layer 2 throughput crossed 100 megagas per second. Networks such as Base, Polygon PoS, Scroll, and Unichain contribute to this growth.
Staking locks a large share of circulating ETH
The shift to proof-of-stake created new mechanisms that remove ETH from circulation. Data shows that more than 37 million ETH currently sits in staking contracts. This supply supports network security while reducing liquid tokens available for trading.
Glassnode estimates that about 25% of the total ETH supply remains locked across staking protocols and exchange-traded products. Despite this illiquid portion, the remaining supply circulates through markets more actively than Bitcoin.
The difference reflects how each blockchain supports its ecosystem. Ethereum hosts thousands of decentralized applications that require constant transactions. Bitcoin does not support the same level of programmable activity.
Price struggles despite record usage
Market prices do not always reflect network usage. Ethereum’s market performance has weakened despite rising activity.
ETH traded near $2000 at the time of writing. The price stands far below its previous peak of $4,946, which occurred during the earlier market cycle. The drop followed six months of broader market outflows.
Bitcoin also faces volatility. The asset traded around $70K, according to TradingView data. The price remained below its recent record of $126,088.
Fee data offers additional context for Ethereum’s current market conditions. Figures from DefiLlama show that Ethereum generated about $11 million in transaction fees over the past month. The network ranked behind Tron and Solana in that period. Ethereum’s protocol revenue stood near $1.22 million, behind Tron, Polygon, Base, and Solana.
A major technical upgrade influenced this shift. The introduction of EIP-4844 reduced transaction costs on Layer 2 networks. The update improved scalability and lowered fees for users. Lower fees also reduced revenue captured by Ethereum’s base layer.
Diverging roles shape the two crypto giants
The contrast between Ethereum and Bitcoin continues to shape market behavior. Bitcoin relies on scarcity and long-term storage as its primary value proposition. Ethereum functions as an infrastructure that powers decentralized applications and financial protocols.
These structural differences influence how investors and users interact with each network. Bitcoin holders often preserve coins for extended periods. Ethereum users must spend or transan articipate in applications that run on the network.
The result appears in on-chain data. Ethereum circulates through markets at a faster pace. Bitcoin remains concentrated in long-term holdings.

Disclaimer: All materials on this site are for informational purposes only. None of the material should be interpreted as investment advice. Please note that, despite the nature of much of the material created and hosted on this website, HODL FM operates as a media and informational platform, not a provider of financial advisory services. The opinions of authors and other contributors are their own and should not be taken as financial advice. If you require advice, HODL FM strongly recommends contacting a qualified industry professional.